U.S. Review
Slack Remains in the Economy, but Signs of Tightening
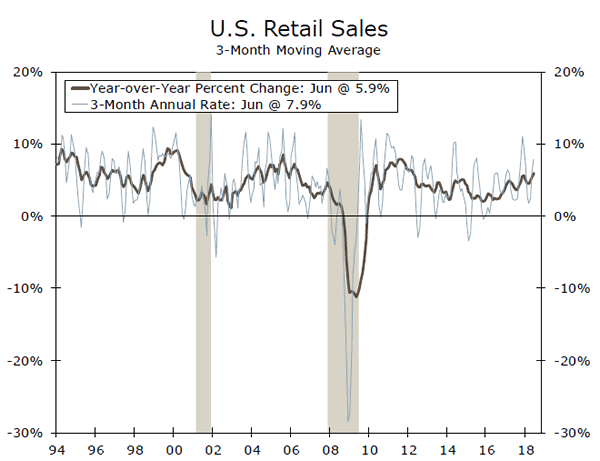
- Retail sales rose 0.5 percent in June, while May’s gain was revised up from 0.8 percent to a robust 1.3 percent. The overall strong pace of retail sales growth puts the consumer on track to drive real GDP growth in Q2, after a weak Q1.
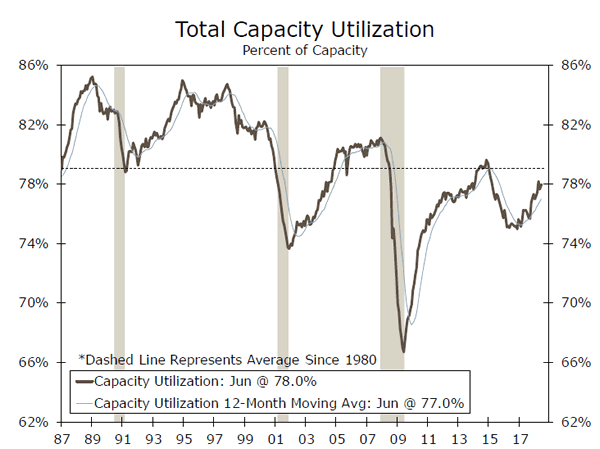
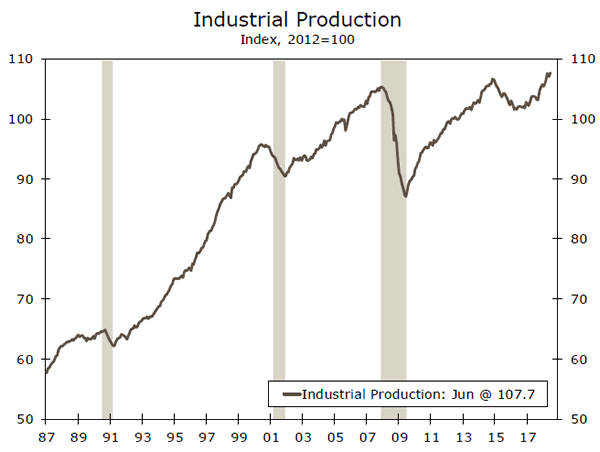
- Industrial production grew 0.6 percent in June to reach a new high. Capacity utilization rose but is still below its historic average, suggesting that slack remains.
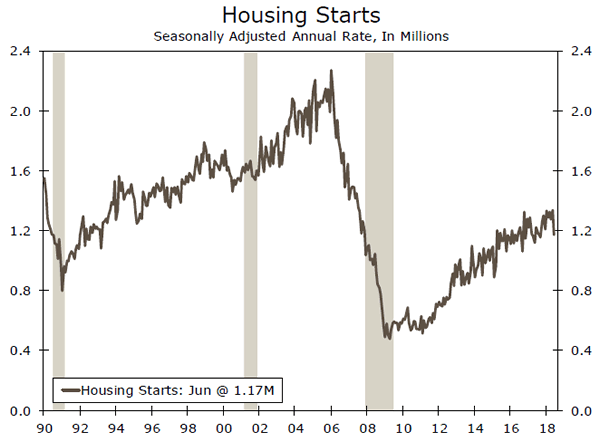
- Housing starts fell 12.3 percent in June, as builders face rising materials costs and increasing labor shortages as barriers to starting construction.
Slack Remains in the Economy, but Signs of Tightening
Retail sales rose 0.5 percent in June, while May’s gain was revised up from 0.8 percent to a robust 1.3 percent. Contributing to the strong pace of headline growth were big gains in sales at car dealerships and gasoline stations. Higher prices at the pump have helped to boost gasoline sales, which are up 21.6 percent year-overyear. Core “control” group retail sales were flat in June, however, as sales declined at general merchandise and clothing stores. The overall strong pace of retail sales growth puts the consumer on track to drive real GDP growth in Q2, after a weak Q1.
Industrial production also looked strong in June, with the index growing 0.6 percent to reach a new high. The June improvement had much to do with a recovery in manufacturing output, coming after a fire at a motor vehicle and parts manufacturing plant disrupted production in May. Output from the manufacturing sector rose 0.8 percent in June, while mining output rose 1.2 percent. Utilities output was the drag, falling 1.5 percent.
Despite tariffs on steel and aluminum imposed in March and expanded to all major trading partners in June, primary metal manufacturing was essentially flat in June. Output of iron and steel products fell 0.8 percent, while aluminum and production and processing declined 3.0 percent. We expect production to expand at least somewhat in the months ahead. Capacity utilization is still below its historic average in the manufacturing sector, at 75.5 percent in June, suggesting that slack remains, and can be deployed to increase production if demand warrants. This contrasts with the mining sector, where an energy-driven rebound has pushed capacity utilization up to a very tight 92.7 percent.
In the housing sector, lack of supply continues to limit sales despite healthy demand for homes. Housing starts came in well below expectations in June, falling 12.3 percent on the back of declines in single-family and multifamily starts. Builders continue to cite rising materials costs as a challenge. Higher prices for steel and softwood lumber, key inputs, likely mean that fewer construction projects are viable. Labor is also becoming scarcer as the economy tightens, another limiting factor. Without a significant pickup in housing starts, the supply of homes available for sale is likely to remain low, and prevent home sales from taking off.
Construction was the only component that weighed on the leading economic index (LEI) in June. The index advanced 0.5 percent, with building permits shaving off 0.6 percentage points. The largest positive contributor was ISM new orders.
Strength in the LEI, which is a composite of ten indicators covering a broad swathe of the economy, is consistent with our generally positive outlook for the United States economy. We expect real GDP growth of 3.1 percent in full-year 2018, which is the highest growth rate since 2005. However, expanding demand will eventually put constraints on supply of labor and resources, as we are seeing play out in the housing sector. We are watching wages and prices in other sectors for signs of growing capacity constraints, and sources of potential risk to our outlook.
U.S. Outlook
New Home Sales • Wednesday
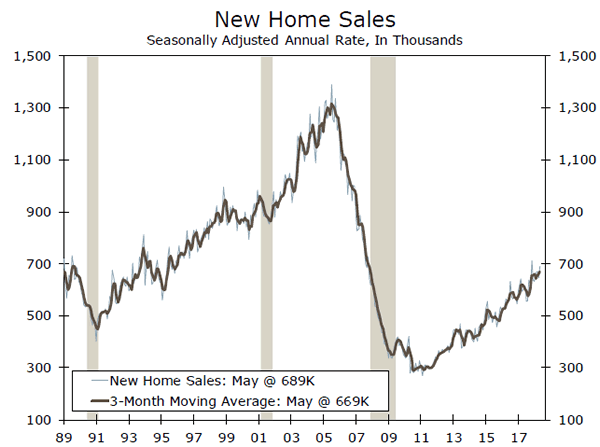
After falling 3.7 percent in April, new home sales rose 6.7 percent in May to a 689,000-unit pace. The housing market continues to be restrained by tight inventories of existing single-family homes, which is likely supporting a more rapid pace of new home sales. Although new home inventories are also low, builders remain relatively optimistic even as they continue to face rising materials costs amid recently-imposed tariffs.
The South remained a standout in May, with new home sales rising 17.9 percent to a new cycle high, while sales fell in the West and Northeast. Development in the South remains solid, where housing starts are up more than 13 percent in June from a year ago, and the region looks poised for further expansion. The average price of a home fell 2.6 percent from a year ago to $369,000 in May, likely due in part to increased sales in the South, where homes tend to be relatively more affordable.
Previous: 689K Wells Fargo: 665K Consensus: 670K
Durable Goods • Thursday
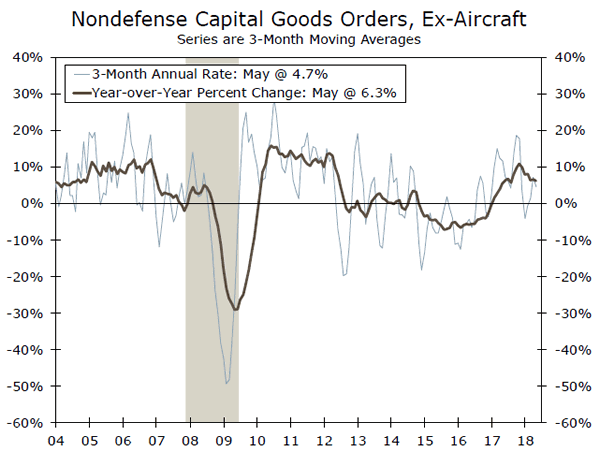
Durable goods orders fell 0.4 percent in May. This drop was a bit smaller than expected, due to the 15.5 percent surge in defense orders. Core capital goods orders were also upwardly revised to a 0.3 percent gain in May, coming on the heels of April’s standout 2.0 percent increase. Shipments remained solid, rising 0.6 percent in the month. The June rebound in industrial production also suggests that durable goods orders are poised for a pickup in June. Unfilled orders continue to rise amid slower inventory growth, as businesses continue to face supply-chain constraints in meeting rising customer demand.
The recent pace of capex spending still represents a slowdown from the record pickup in spending registered in the second half of 2017. However, we look for durable goods orders to rise 3.2 percent in June, signaling a solid pace of equipment spending in the remainder of the year.
Previous: 0.4% Wells Fargo: 3.2% Consensus: 2.8% (Month-over-Month)
GDP • Friday
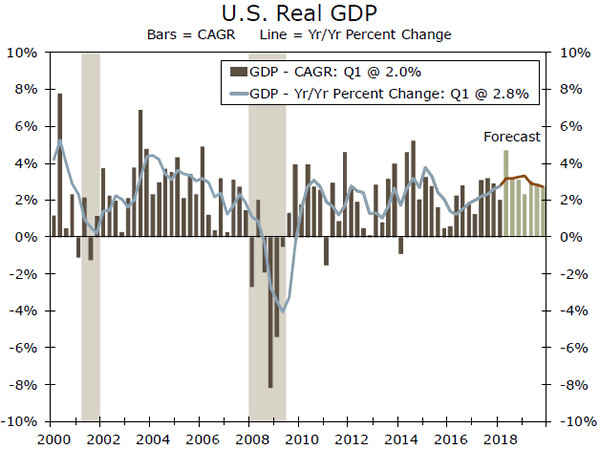
After rising a tepid 2.0 percent annualized in Q1, GDP growth is expected to rebound strongly in Q2. We look for GDP to rise to a 4.7 percent annualized pace amid a sharp narrowing in the trade deficit and pickup in consumer and business spending. Solid retail sales, rising wages and strong job gains support our forecast for consumer spending to rise to a 3.3 percent annualized clip. Business spending also likely remained solid, albeit growing at a slower rate than the run up seen in Q1. The pickup in durable goods orders and shipments noted above signals that equipment spending likely rose at a roughly 5 percent annualized pace. Q2 GDP also likely got a boost from stronger exports as businesses tried to get ahead of retaliatory tariffs, and we look for the narrowing in the trade deficit to add 1.2 percentage points to topline growth. The trends behind the likely Q2 rebound should support solid growth in H2-2018, although trade tensions present a possible downside risk to our outlook.
Previous: 2.0% Wells Fargo: 4.7% Consensus: 4.0% (Quarter-over-Quarter, Annualized)
Global Review
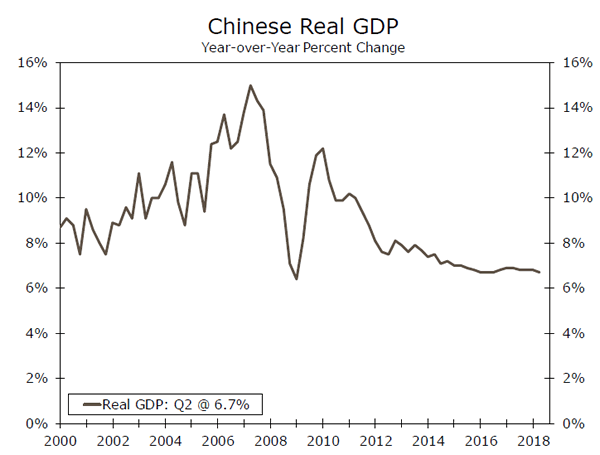
Chinese GDP Growth Slowed Marginally in Q2
- Real GDP growth in China ticked lower in Q2 due, at least in part, to further deceleration in investment spending. We look for Chinese GDP growth to trend gradually lower in coming quarters.
Will the MPC Raise Rates Next Month?
- Some high-profile data releases in the United Kingdom were weaker than expected this week. However, the British economy is hardly falling apart, and we still look for the Monetary Policy Committee to hike rates at its next policy meeting on August 2.
Chinese GDP Growth Slowed Marginally in Q2
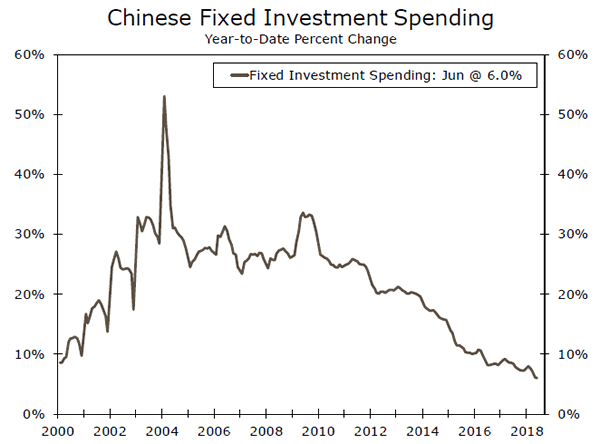
Data released this week showed that the year-over-year rate of real GDP growth in China slowed marginally to 6.7 percent in the second quarter, from 6.8 percent in Q1-2018 (see chart on front page). A full breakdown of the GDP data into its underlying demand components is not readily available, but monthly economic indicators show that growth in investment spending, which has been behind the deceleration that has occurred in the Chinese economy over the past few years, slowed further in Q2 (top chart). We forecast that Chinese GDP growth will tick lower in coming quarters, but we do not look for the economy to experience a sharp downturn anytime soon. (For further reading see “China Mid-Year Economic Outlook” which is posted on our website.)
Will the MPC Raise Rates Next Month?
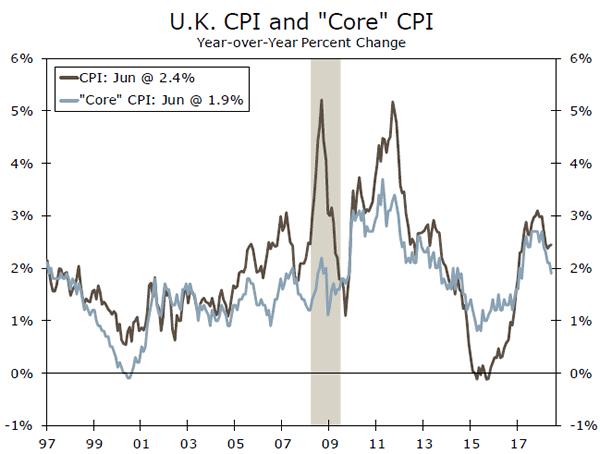
British economic data that were released this week cast some doubt on the widely-held expectation that the Monetary Policy Committee (MPC) of the Bank of England (BoE) will hike rates at its next policy meeting on August 2nd. For starters, inflation data for June were weaker than most analysts had expected. To wit, the overall rate of CPI inflation held steady at 2.4 percent, rather than ticking up as most analysts had expected, and the core rate of inflation dropped to 1.9 percent from the 2.1 percent rate that had been registered in May (middle chart). Furthermore, real retail sales slipped 0.5 percent in June relative to the previous month, significantly weaker than the modest increase that the consensus forecast had anticipated. If inflation is receding back toward the BoE’s target of 2 percent and spending data are weaker than expected, why should the MPC be in a hurry to hike rates?
Although some of the data this week were modestly disappointing, the British economy is hardly falling apart. Even with the drop in retail sales in June, real retail spending was still up 2.1 percent (8.5 percent at an annualized rate) in the second quarter relative to Q1. Employment was up 137,000 workers in the March-May period relative to the preceding three-month period, and the unemployment rate held steady at its 43-year low of 4.2 percent. The U.K. Office for National Statistics estimates that real GDP rose 0.2 percent in April (not annualized) and another 0.3 percent in May.
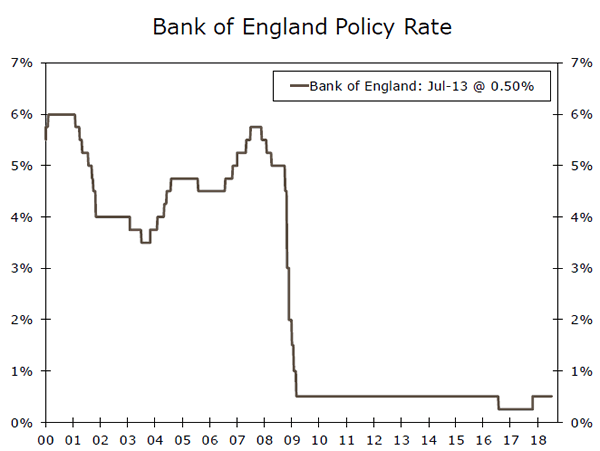
At its most recent policy meeting on June 21, the MPC stated that “were the economy to develop broadly in line with the May Inflation Report projections, an ongoing tightening of monetary policy over the forecast period would be appropriate to return inflation sustainably to its target.” The MPC currently forecasts that real GDP will grow roughly 1-¾ percent per annum over the next few years. The wiggles in recent data notwithstanding, U.K. GDP appears to be on track to grow more or less at this modest pace, which the MPC estimates is slightly higher than the long-run potential rate of growth. Moreover, three members of the ninemember MPC voted to raise ratesat the last policy meeting. With the policy rate at historically low levels (bottom chart), we believe that at least two more voters will join those three members, which will lead to a rate hike on August 2nd. Stay tuned.
Global Outlook
Eurozone PMIs • Tuesday
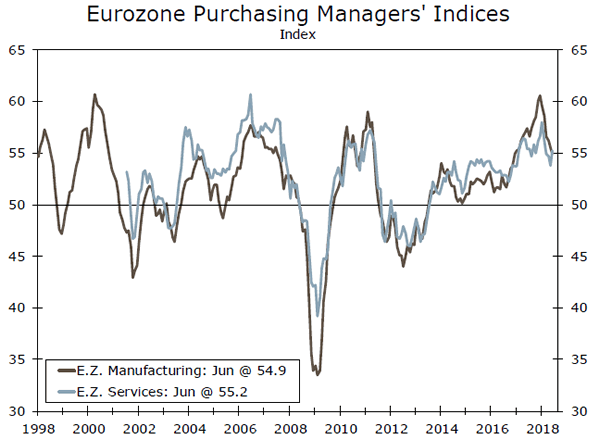
Some of the early Q3 readings on the Eurozone economy will print next week with Markit’s Purchasing Manager Indices. As illustrated in the chart to the right, economic activity in Europe cooled somewhat in the first half of the year relative to H2-2017. That said, the June readings near 55 for the manufacturing and service sectors are consistent with a healthy expansion and economic growth that remains a bit above potential growth. So long as growth holds around current levels, it should be enough to gradually diminish remaining slack in the labor market and slowly push up core inflation.
The European Central Bank will also meet next week (Thursday). Any major policy move from the ECB is unlikely, but this will be the first meeting since June when the ECB laid out its tapering and rate hike paths. As a result, the ECB may take the opportunity to clarify anything that policymakers believe financial markets interpreted as too hawkish or dovish.
Previous: 54.9 (Services); 55.2 (Manufacturing) Consensus: 55.2 (Services); 54.8 (Manufacturing)
South Korea GDP • Wednesday
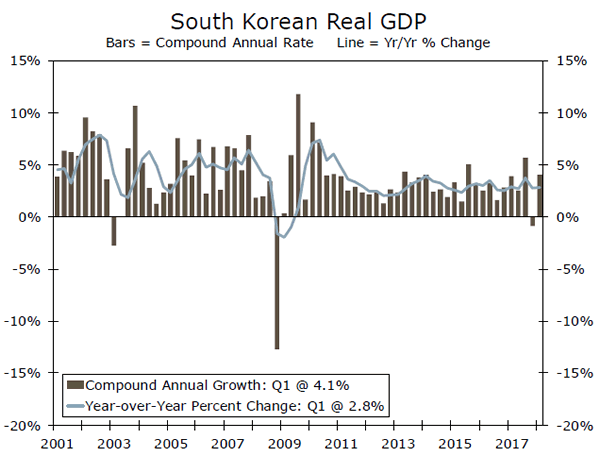
Economic growth in South Korea has been remarkably stable over the past few years. A weak Q4-2017 was sandwiched between two quarters of annualized real GDP growth above 4 percent. A soft print for personal consumption in Q1 was offset by strong growth in investment spending and robust export growth.
At its most recent policy meeting in July, the Bank of Korea held its policy rate steady and downgraded its 2018 growth projection to 2.9 percent from 3.0 percent previously, citing corporate earnings and trade tensions as causes for the adjustment. Trade tensions are a major source of uncertainty for the BoK, as total exports as a share of GDP are more than 50 percent. With inflation in check and unemployment still somewhat high for structural reasons, economic conditions are not yet completely supportive of less policy accommodation. Next week’s GDP print will give policymakers a better sense of how far off the next rate hike remains.
Previous: 1.0% Wells Fargo: 1.0% Consensus: 0.7% (Quarter-over-Quarter)
Central Bank of Russia • Friday
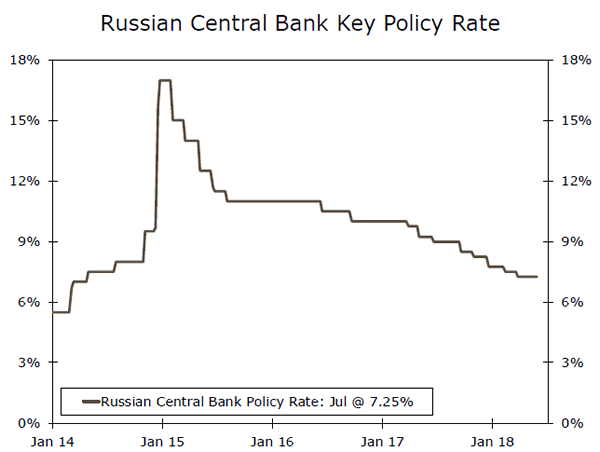
The Central Bank of Russia began cutting its main policy rate in 2017 as inflation finally receded from its double digit pace and the ruble found firmer footing. At its past couple meetings, however, monetary policy has held steady amid a mix of conflicting economic signals. Economic growth was up just 1.3 percent year over year in Q1-2018, a bit weaker than expected and suggesting more monetary policy easing might be in the cards.
However, inflation appears to be hitting a trough, as the central bank stated at its last meeting that the “balance of risks up to the end of 2019 have shifted towards proinflationary.” In addition, the ruble has remained under some pressure since additional U.S. sanctions were announced in April; the ruble is down about 11 percent for the year against the dollar. With this combination of conflicting factors on policymakers’ mind, the Bloomberg consensus looks for the central bank to remain on hold at its meeting next Friday.
Previous: 7.25% Consensus: 7.25%
Point of View
Interest Rate Watch
Questioning the Questions
Following Fed Chairman Jerome Powell’s testimony this week, we were engaged by several questions (and answers) that appeared to be slightly at odds with how we view the state of economic affairs.
Wages, Inflation and Real Incomes
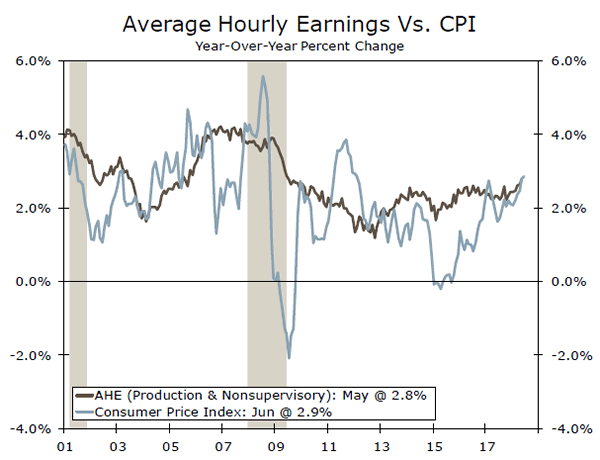
One assertion was that wages lag inflation, and that real wages have declined for many years. We find inflation has outpaced wages in only a handful of months since 2013 (top chart). Inflation evidences several spikes; but, over time, wages have exceeded inflation. Moreover, wages are only one form of compensation to workers—indeed, non-taxed health care benefits are an increasingly important part of labor compensation. To the point, real disposable income has grown 1.7 percent from a year ago, and at a 2.3 percent annualized rate over the past three months.
Loan Growth Has Slowed
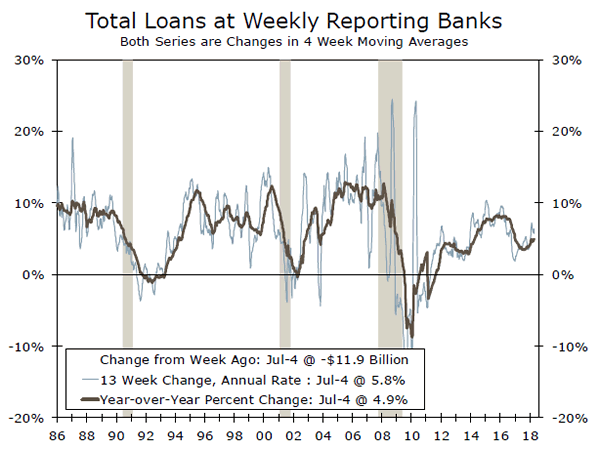
There was an additional assertion that loan growth has slowed to less than half of what it was during the last year of the Obama Administration. We find total loans at banks have continued to slow since their cycle high in late 2016 (middle chart). Over the past 13 weeks, loan growth has increased 5.8 percent, and is up 4.9 percent over the past year. However, loan growth was at no time double these numbers in the Obama Administration. Growth has not hit the 10 percent mark in this cycle.
Moreover, the character of credit in the economy has become far more broad-based over time. Credit is available in many forms and from many sources. According to the NFIB small business survey, the difference between firms reporting credit is harder versus easier to get is far below the peaks of 2009-2014 and consistent with past easy credit periods.
Inflation as Leading Inflation?
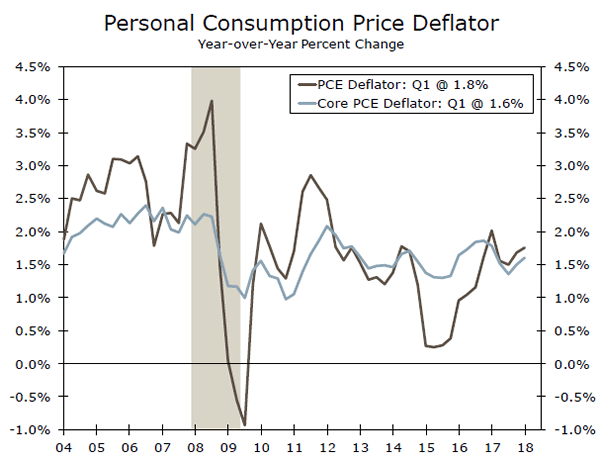
An additional assertion was that core inflation is a better indicator of future inflation than overall inflation. We find two way causality between core inflation and overall inflation (bottom chart). Both series come from the same source, the BLS, and core is part of overall inflation.
Credit Market Insights
Shifts in Mortgage Market
While presenting the Fed’s semi-annual Monetary Policy Report to Congress this week, Fed Chair Powell stroke an optimistic tone on the economy. However, the report noted that “activity in the housing market has leveled off this year.”
In his testimony, Powell expanded on some of the factors that are holding back activity in the housing market, stating that “there are probably significant numbers of credit worthy borrowers who are not getting access to mortgage credit.” Mortgage lending standards at banks became much stricter after the recession, and have yet to return to historic norms, as banks remain cautious on lending. The Urban Institute’s housing credit availability index, which measures default risk taken by the mortgage market, is still more than 50 percent below its average in the 2001-2003 period.
Mortgage rates are also moving up as the Fed tightens monetary policy. The average 30-year rate mortgage rate has increased 52 bps since the start of the year. At the same time, homes are becoming more expensive, with the Case-Shiller National Home Price Index up 6.4 percent on the year. The combination of rising home prices and higher mortgage rates stands to put further barriers in front of households looking to take out a mortgage.
However, strong employment gains and faster income growth should help mitigate the barriers facing prospective homebuyers. On balance, we expect modest gains in housing market activity over the next year.
Topic of the Week
Tallying Up Tariffs: The Effect on Inflation
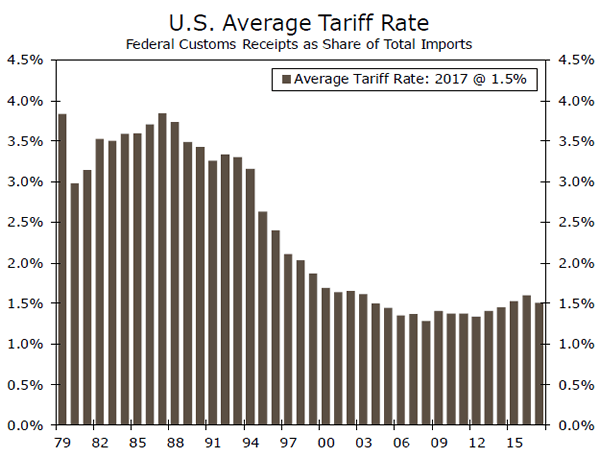
Trade tensions have been escalating since the spring, when President Trump announced tariffs on steel and aluminum imports. While effective tariffs on U.S. imports have fallen substantially since the mid-1980s (top chart), it is clear that rates are no longer declining.
In total, the Trump administration’s major tariff changes apply to $90 billion of U.S. imports, with an average rate of 22 percent. However, the value of proposed tariffs are materially higher. If enacted, they would add $485 billion to goods affected. One possible effect of tariffs is changes in the consumer price level. We expect the tariffs already imposed to increase headline CPI, which is currently at 2.8 percent, by 0.1 percentage point, keeping all other factors constant. Taking into account the additional tariffs being floated, the change in headline CPI would rise 0.5 percentage point.
Why is the change to headline CPI relatively small? Spending on consumer goods accounts for only about one-third of consumer outlays, so this limits the effect of higher goods prices on average consumer prices. Also, the majority of tariffs enacted are focused on intermediate goods. Relatively high profit margins mean that companies have the ability to absorb some increases in the cost of production without pushing price increases onto the consumer. Firms are also likely to re-adjust supply chains to avoid tariffs over time. A stronger U.S. dollar in the face of trade tensions and retaliatory tariffs, which can lead to increased domestic supply if fewer goods are exported, provide further offsetting effects.
Overall, effects of tariffs that have already been enacted should be small enough to where the Fed does not need to alter its current course of policy on the basis of inflation. The FOMC has stressed its willingness to accept a modest overshoot for a time given the symmetric nature of its inflation target. The additional proposed measures, however, stand to push inflation noticeably higher and weigh more meaningfully on real consumer spending.
For more on this topic, see our recent report “Tallying Up Tariffs: The Effect on Inflation” (July 19, 2018)