
Highlights
- Markets are pricing a cut in Canadian and U.S. policy rates, while central bankers are still showing a gap relative to their higher estimated neutral rates. Herein lies the challenge with applying theoretical frameworks to unobservable variables.
- Although the Federal Reserve has at least arrived at the bottom end of its neutral range, the Bank of Canada remains quite a distance from their past estimates. Structural changes within the Canadian economy and the inherent limitations of models have led us to entertain a real neutral rate that will not only fall short of past estimates, but ultimately hover near zero or less.
Of all the benchmarks in modern finance, the policy rates set by central banks are the most closely watched and critiqued. The guidepost is typically intertwined within the concept of r-star (r*), often referred to as the neutral rate. In theory, the neutral rate allows an economy to allocate resources in a manner where the pace of economic expansion corresponds with full employment and stable inflation. It’s a “goldilocks rate” that neither stokes nor stifles demand.
The theoretical concept is easy to grasp, however getting the estimate of r* right is anything but. Most economists can agree that r* is lower today than the pre-recession experience, due in large part to aging demographics that have cut labor force growth projections and slower productivity growth from prior decades. However, if you put five economists in a room to determine a specific pin-point value on r*, there’s a good chance you’ll get six different estimates.
The neutral rate is ultimately an unobservable variable. Knowing whether you were in the ballpark occurs only with hindsight years later. In addition, an estimated value of r* requires a combination of inputs from other unobservable variables and/or a reliance on assumptions based on historical relationships that may not hold constant over time. Hence our “phantom menace” reference as the title of this report, which aptly captures the conceptual complexity and the resulting divergent views of the neutral rate. Central bankers and economists have to navigate real-time data, often with a high degree of measurement error, employing judgement along every step of the way. Here in lies the crux of the matter. The policy rate is crucial in guiding the path for bond yields, mortgage rates, risk assets, and global financial flows. In the ultimate exercise of trial-and-error, it’s important to understand the framework and inherent limitations in modelling the underpinnings to r*.
Master Yoda says: Be mindful of the future
The neutral rate has two distinct “time” dimension concepts: long-term equilibrium and time-variance. The long-term equilibrium concept is based on structural supply-side developments within the economy related to demographics and productivity. This textbook r* concept marks the theoretical level that maintains an economy at a non-inflationary running speed in the absence of an output gap. However, getting there requires a more nuanced r* concept that is “time-variant”. This estimation takes into account cyclicality and the level of interest rates that would help output converge back to its long-term potential when it’s knocked off that path. Chart 1 offers three examples of the time-variant r*, all of which suggest that the Fed Funds policy rate is already within spitting distance of estimates of the neutral rate.
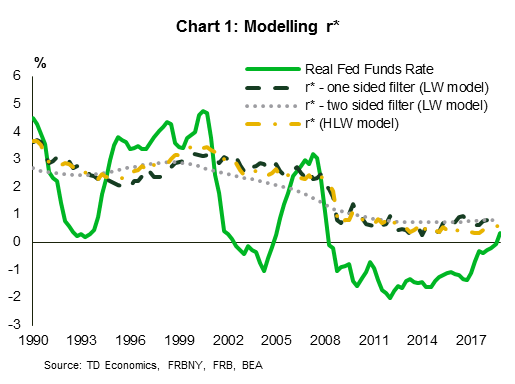
Regardless of which r* is estimated, one phenomenon holds true for both: large estimation error. In recognition, economists don’t rely on a single methodology. Rather, they run the logic through various theoretical paths and present neutral estimates within a range, rather than a point-estimate. As an example, a 2018 paper by Bank of Canada researchers reviewed four modelling approaches for r*. Highly similar r* results were produced across all frameworks, with estimates falling within a range of 2.50% to 3.75%. Stripping off inflation implies a positive neutral rate of 0.50% to 1.75%.
Canada’s real policy rate sits at roughly -0.25% using forward inflation expectations. As such, one could conclude that there’s more room to the upside since it has yet to even kiss that bottom end of the neutral range. However, herein lies a flaw. Why did all four empirical approaches support similar positive neutral ranges? It is partly because of a reliance on similar assumptions for unobservable variables and their theoretical relationships, which ultimately causes estimates to converge onto each other.
For instance, a Canadian neutral rate can be estimated based on domestic trends and/or in combination with estimates of the U.S. or broader global neutral rates. The fact that Canada is an open economy with capital mobility means that global financial linkages should keep r* reasonably close to that of its peers. However, the global r* calculation is based on the same assumptions as those used in the domestic version. The models generally rely on a combination of estimates for potential GDP, the relationship between economic slack with inflation, and the time preference for saving. All of these incorporate elements that are unobservable at the time of estimation.
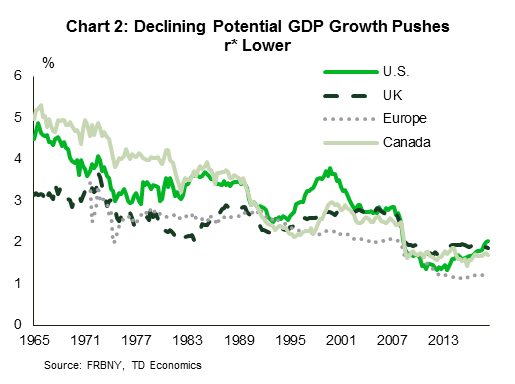
Take potential GDP growth (Chart 2). It is determined by the growth of the labor force and productivity. Sounds easy enough. Birth and death rates are transparent, as are working age cohorts. But what if changing patterns in immigration or government policies subsequently alter these estimates? What if productivity turns out to be more of a moving target? Estimates of the latter have consistently disappointed globally, causing an economic paradox relative to historical experience and the rate of technological change over the last decade. It is estimated that for every 1% change in potential GDP growth, r* changes by the same magnitude. If our demographic or productivity assumptions are off by as little as half a percentage point to the downside, r* ends up also being off by the same magnitude. For instance, using productivity growth from 2000s decade as the benchmark for the current cycle would have over predicted potential GDP growth and r* by 0.6 percentage points. Since the calculation of a trend rate of growth carries historical bias that’s embedded within a common framework, assumptions can suffer from clustering within the economics community.
The key takeaway is that the modelling approaches offer a thought-framework and starting point to the analysis, but they are not a silver bullet on the value of r*. Judgement and continual assessment of the data is required as central bankers probe for that equilibrium level of a real-time unobservable variable. And, this all needs to be done in consideration of changing regimes. The past decade has brought forward complexities related to a global savings glut, central bank asset purchases, and higher financial sector regulatory standards that create larger capital buffers and more demand for risk-free assets. Canada has been more active than most other countries in imposing macro-prudential rules within the residential real estate sector that has left mortgage qualifying rates far higher than what is simply implied by the policy rate and related mortgage rate spreads. All of these drivers influence r* where there are no historical observations from which to draw.
The path of the Jedi
Some criticism was laid at the feet of the Federal Reserve on the recent about-face in the span of a few months. The Fed Chair went from saying “we’re a long way from neutral” interest rates, to shifting to a neutral stance. Knowing the inherent limitations of models, we would be more concerned if a central bank did not alter its assessment in the face of data developments that challenge their ‘priors’.
By extension, we think the Bank of Canada will set a course of stable interest rates going forward. One of the biggest shifts that occurred in our quarterly March forecast was the removal of any further interest rate hikes from our outlook. We hit the stop button. This is an out-of-consensus call where the median consensus estimate among economists is still incorporating 40 bps of rate increases in 2019.
For us to re-evaluate this position, we need to have confidence in a Canadian economy that can hold above 2% real GDP growth for several quarters. However, our forecast model fails to produce this result. If we have exercised the right judgement, this implies that Canada has already arrived at the time-variant neutral rate, which leaves it modestly in negative territory. Consumer-led data have demonstrated interest rate sensitivity to a greater than expected degree. When combined with key structural changes within the economy, this lead us to suspect that the policy rate needs to remain lower than past estimates of long-term r* for the following reasons:
- The high degree of household leverage
- Structural changes to the export sector.
- When the consumer sector cools, an “escape route” for Canada has often been the external sector. A depreciation of the Canadian dollar and healthy U.S. demand provide an offsetting force through exports. This dynamic, however, has become more muted over the past decade and incoming data appear to reinforce this theme.
- Related structural changes in investment and productivity in Canada, and even globally.
Despite the Bank of Canada’s real policy rate being in slight negative territory, we see a significantly positive r* is becoming less convincing. Canada may very well require the real interest rate to remain close to or below zero for a long period. We need only cast our eyes to Japan and Europe for two real-time case studies. Periods of deleveraging typically have strong negative forces on potential GDP and the ability to maintain inflation at target. The U.S. is a decade removed from the beginning of their household deleveraging cycle and there still appears to be scarring that limits r* from being higher. Canada is just at the starting point of that deleveraging process and it will take years to unwind. This risks an extended period where desired savings and investment are structurally impacted.
Bottom Line
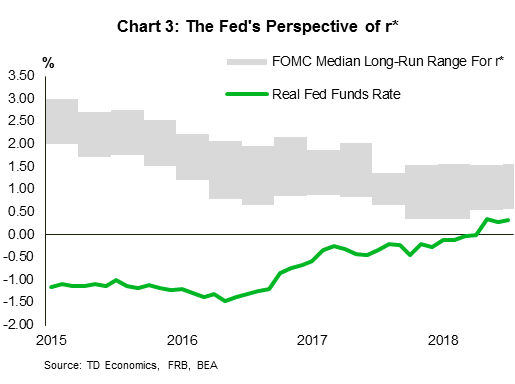
When it comes to the estimation of r*, we think Federal Reserve Chair, Powell, summed it up nicely when he noted “guiding policy by the stars … has been quite challenging of late because our best estimates of the location of the stars have been changing significantly” (Chart 3). There is no single anchor for r* and we are ultimately engaged in a trial-and-error exercise that leaves past estimated ranges under scrutiny. If nothing else, the confidence bands are likely wider and should entertain a time-variant real neutral rate that can be negative.


