
Worst growth on record
The Chinese economy grew 6.0% y/y in the third quarter, a slowdown from Q2’s +6.2% and the weakest growth on record going back to 1995. Quarter-on-quarter growth slowed to 1.5% y/y but was in line with economists’ estimates.
In the subsequent press conference, the Statistics Bureau acknowledged that the domestic economy faces a complex and serious situation amid a rise in external uncertainties. Net exports made up 19.6% of the year-to-date growth while capital formation contributed 19.8%. It put a brave face on the numbers, saying it felt the policy measures already in place were starting to filter through into the economy and was certain stable growth could be maintained into Q4.
Industrial production beats estimates
In other data released at the same time, September industrial production rose 5.8% y/y, beating expectations of 5.0% and the quickest expansion in three months. Retail sales for the same month were bang in line with forecasts, rising 7.8% y/y, a faster pace than August’s +7.5%. Fixed asset investment rose 5.4% y/y year-to-date, matching economists’ predictions but a slight slowdown from the +5.5% seen in August.
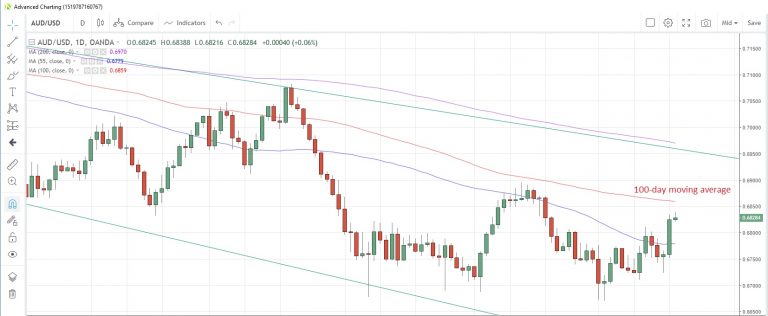
AUD/USD sees muted reaction
The better-than-forecast industrial production data appeared to take some of the sting out of the weak growth numbers. AUD/USD eased off an intra-day high of 0.6840, the highest since September 18, after the data, but only gave up about 10 ticks, and is now trading at 0.6829.
The reaction in yuan markets was also almost non-existent, the USD/CNH sliding as much as 0.17% to 7.0695 but is now down just 0.04% at 7.0785. There was more reaction from equity markets with the China50 index slipping 0.67% to 14,020.
AUD/USD Daily Chart
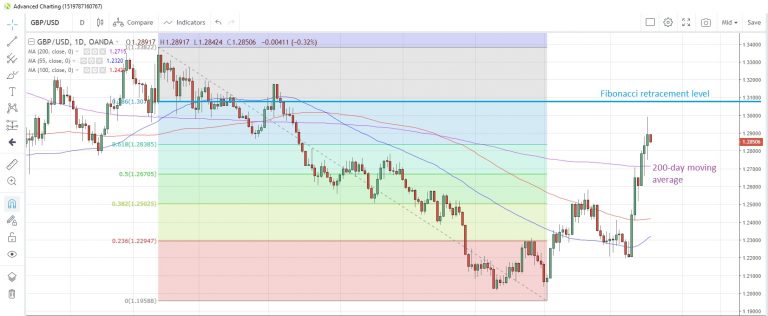
Deal or no deal?
The volatility in the pound has certainly been more exciting (or nerve wracking). Euphoria from a deal announcement was quickly followed by dismay yesterday as support from MPs and other parties appeared to evaporate. Boris Johnson has a tough task on his hands to get it passed through Parliament in a special sitting on Saturday. Whichever way the vote goes, the pound is likely to be grabbing the headlines early Monday morning.
In the meantime, GBP/USD traded in a relatively tight 40 point range in Asia, edging lower by 0.33% to 1.2850. Technical levels become irrelevant amid wild swings, but for the record the 78.6% Fibonacci retracement of the March-September drop is at 1.3077 while the 200-day moving average is at 1.2715.
GBP/USD Daily Chart
A slow drift into the weekend?
The data calendar has little to offer for the rest of the day as we ease into the weekend. Apart from any Brexit deal-related headlines, there is only Euro-zone current account data for August scheduled for Europe, while the North American session has no data releases, just speeches from Fed’s George, Kaplan and Clarida followed by Bank of Canada’s Lane.


