
US stocks declined for the third straight day. The Dow and S&P500 declined by 0.20% and 0.16% respectively. In Asia, stocks attempted to stabilise, with Nikkei and Hang Seng gaining by 0.47% and 0.20%. This has been a tough week for the markets as traders have received mixed signals about trade. On Sunday, China reported that the US and China were having constructive talks on trade. It later emerged that there were key differences in what could be in the first phase of the trade deal. Some traders believe that this delay could extend to the coming year.
The USD strengthened in overnight trading. This was in reaction to Philadelphia Fed manufacturing index data, which was released yesterday. The index rose from 5.6 in October to 10.4 this month. This is a signal that the manufacturing industry is stabilising. The market will receive the flash manufacturing PMI data from Markit. At the same time, the market has already priced in the Fed action for the coming month. Going by Jerome Powell’s statements and the minutes released on Wednesday, the Fed will leave rates unchanged.
The market will focus on the euro ahead of key economic data. In Germany, the market will receive a preliminary reading of the third quarter’s GDP. The data is expected to show that the economy grew by 0.5% in the third quarter. On a QoQ basis, the economy is expected to have improved by 0.1% from the previous -0.2%. The flash PMI is expected to improve from 42.1 to 42.9. Services PMI is expected to improve from 51.6 to 52.0. In the European Union, the flash manufacturing PMI is expected to improve from 45.9 to 46.4.
EUR/USD
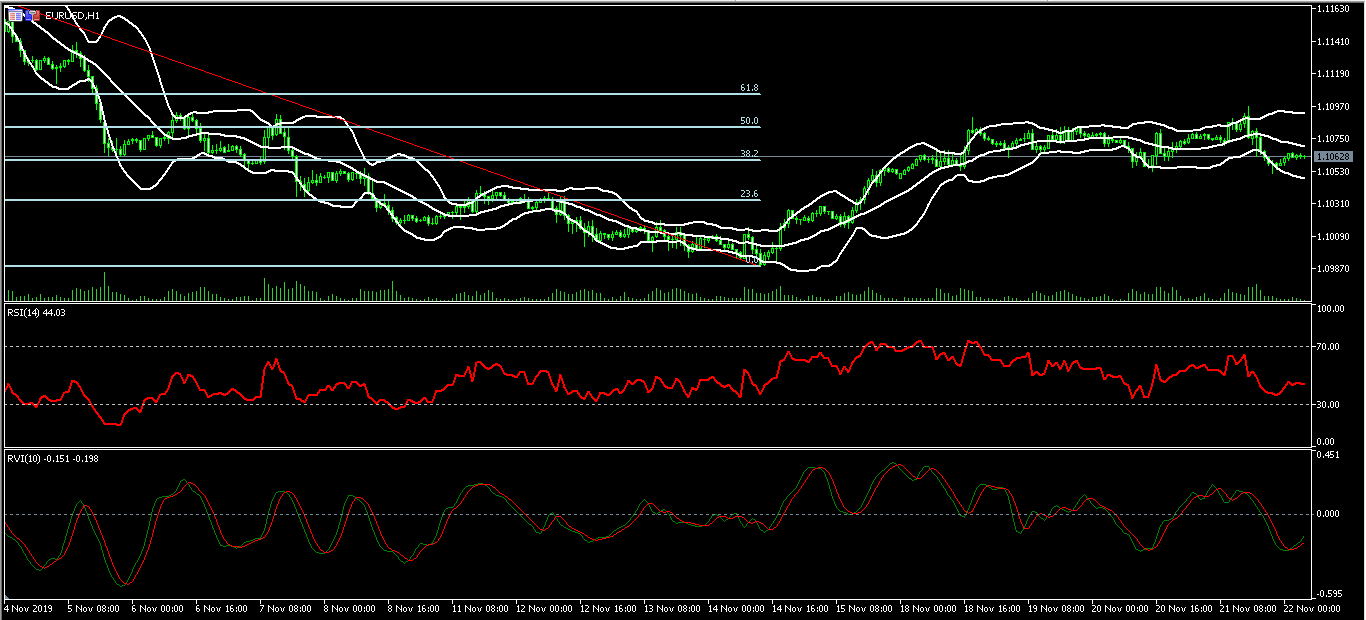
The EUR/USD pair declined from a high of 1.1097 to a low of 1.1050. It is now trading at 1.1062, which is along the 38.2% Fibonacci Retracement level on the hourly chart. The price is also between the middle and lower lines of the Bollinger Bands. The RSI has stabilised at the current level of 42. The pair may see some significant volatility today as the markets receive PMI data from Europe.
XBR/USD
XBR/USD has been on a sharp upward trend since Wednesday when it bottomed at 59.54. The pair reached a high of 63.03 yesterday. It has now declined slightly and is trading at 62.55. On the hourly chart, the price is slightly below the upper line of the Bollinger Bands. The RSI has moved from a high of 80 to the current 65. The signal line of MACD has made a bearish crossover with the mainline. This is a signal that the pair could move lower today. If it does, 62.00 will be the level to watch.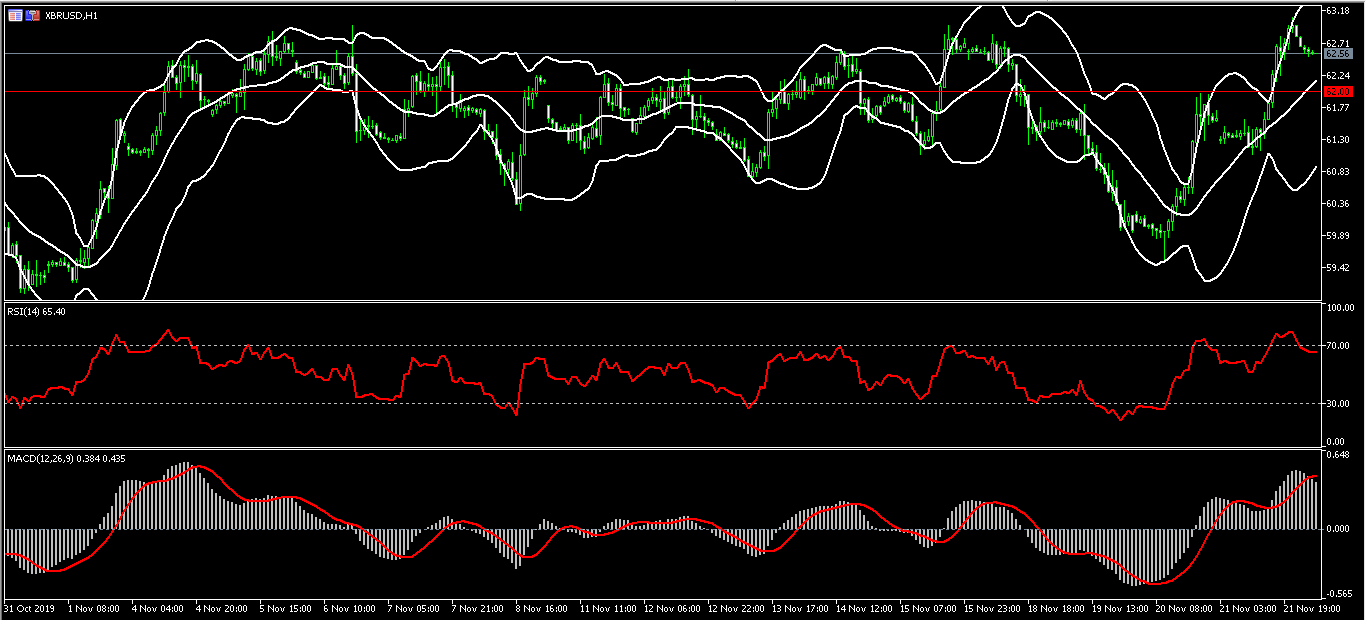
BTC/USD
The BTC/USD pair has been on a downward trend after it reached a high of $9938 in October. The pair reached a low of 7323, which was an important support. It is now trading at 7596. The price is below the 14-day and 28-day moving averages while the RSI remains in the oversold level. The signal and main lines of MACD remains below the oversold level. The pair may continue to decline to test the important support of 7550.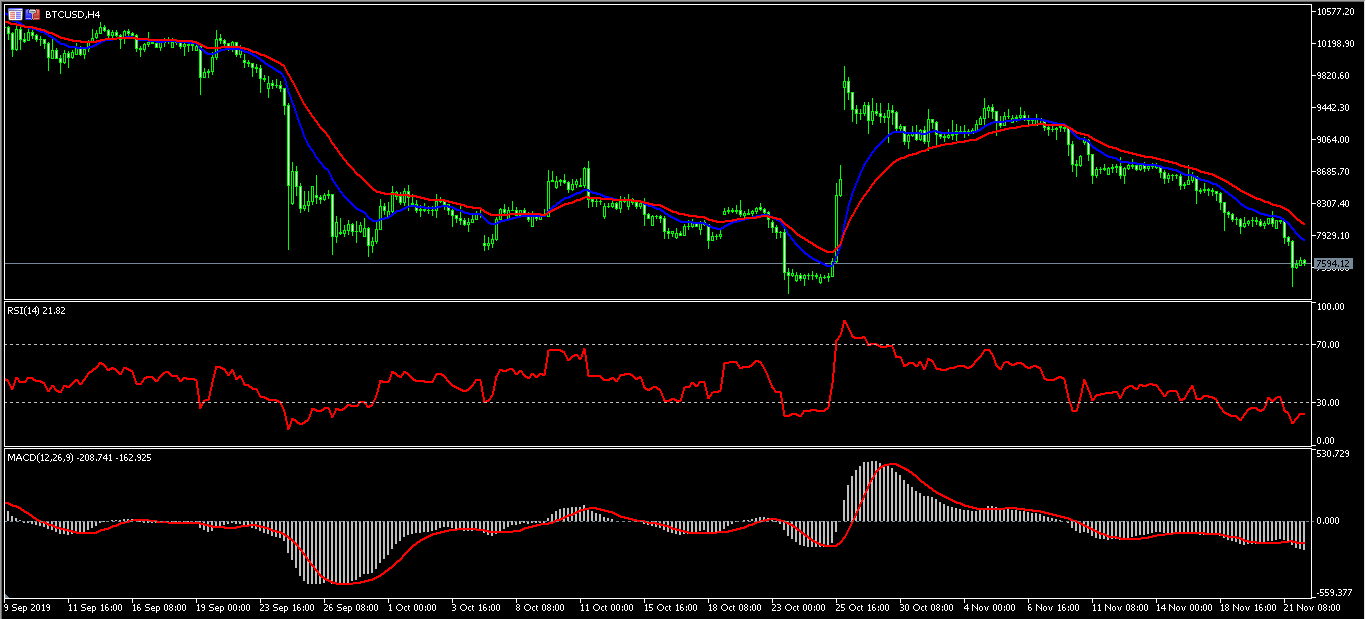


