
Nasdaq-100: ⬆️ Buy
– Nasdaq-100 reversed from support zone
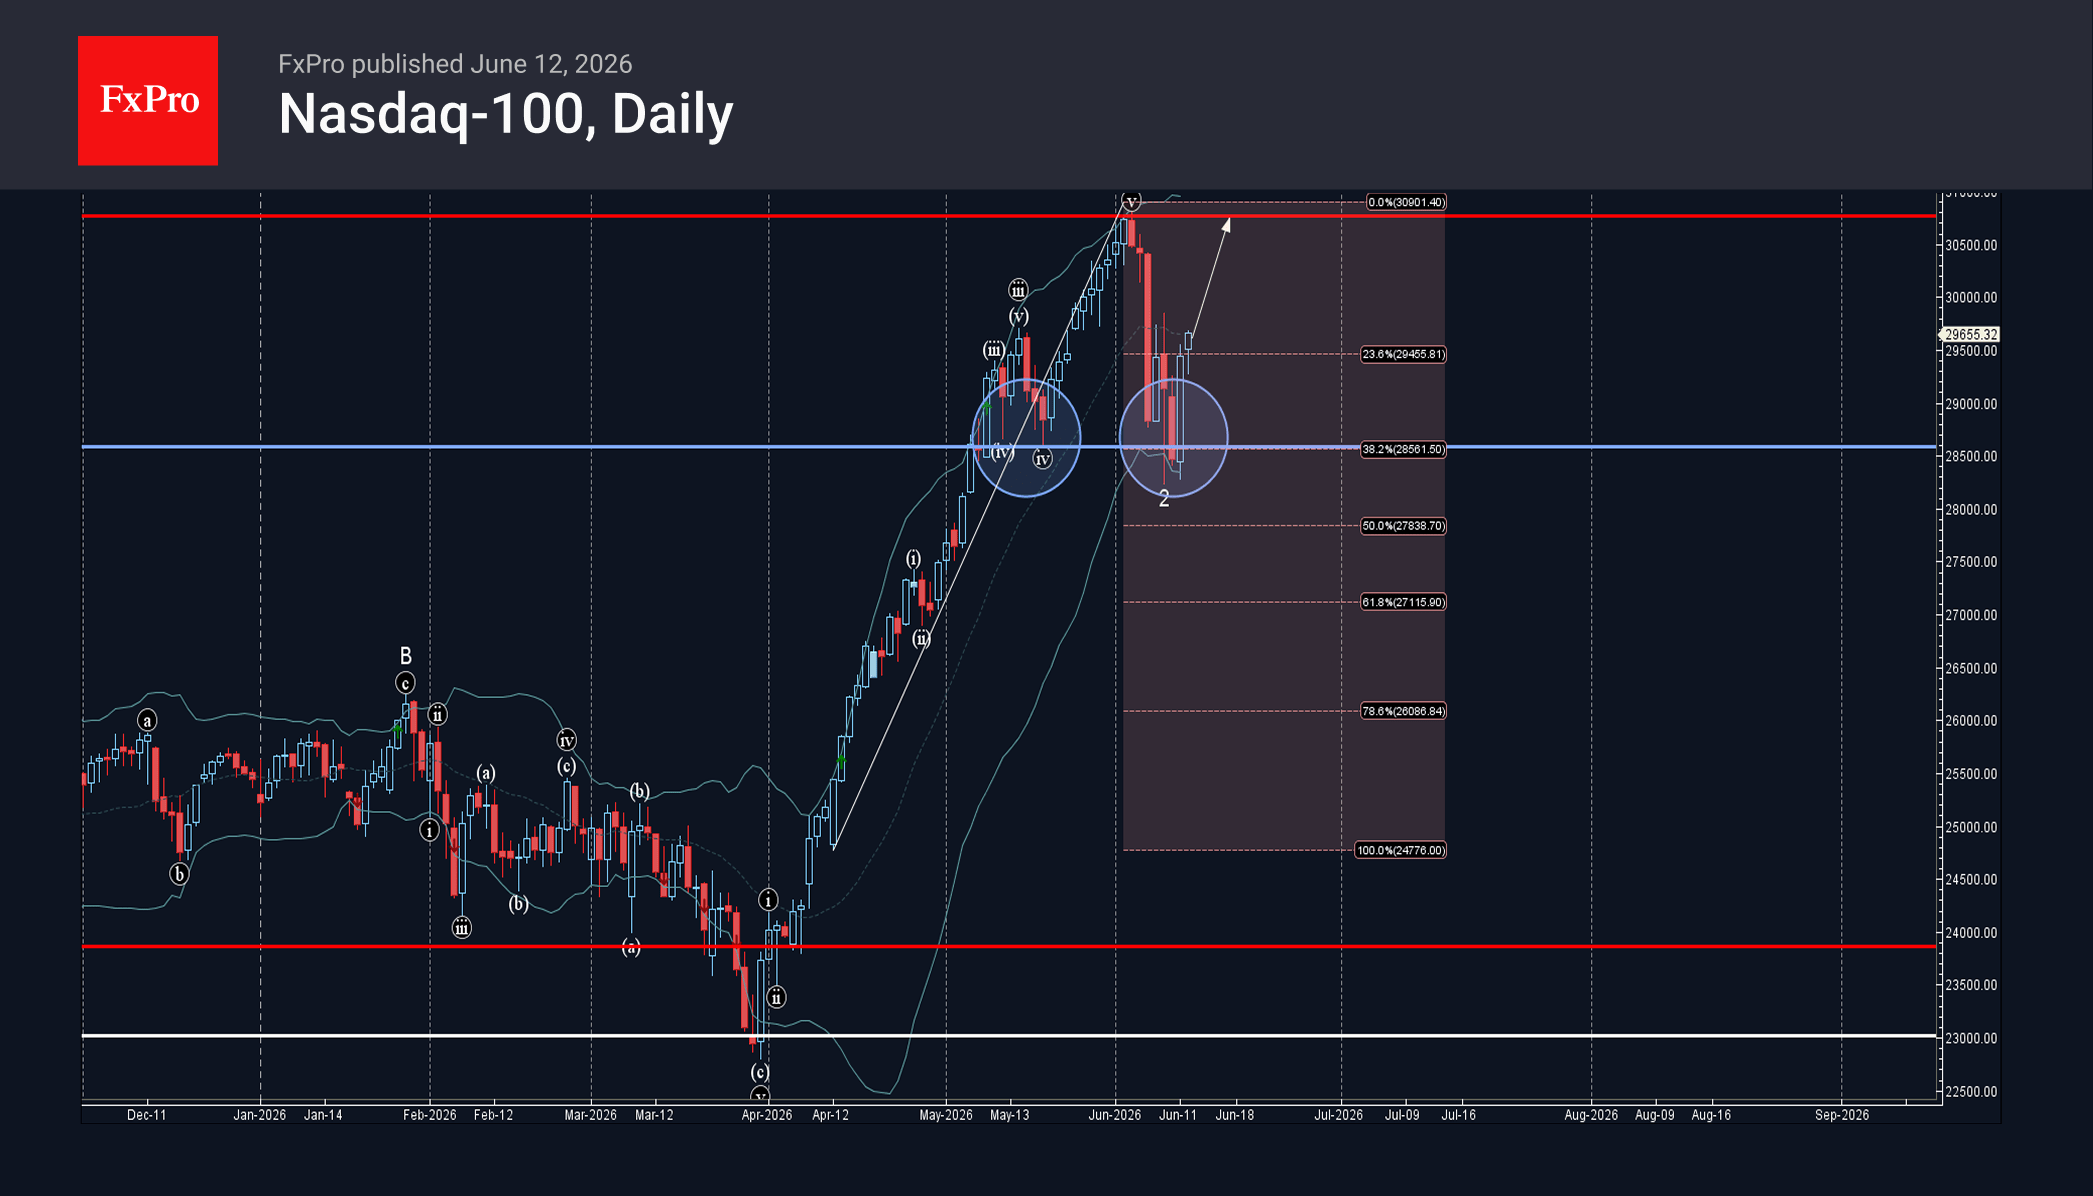
– Likely to rise to resistance level 30770.00
Nasdaq-100 index recently reversed up from the support zone between the support level 28585.00 (which stopped earlier corrections (iv) and iv), lower daily Bollinger Band and the 38.2% Fibonacci correction of the upward impulse from April.
The upward reversal from this support zone created the daily Japanese candlesticks reversal pattern Bullish Engulfing – which started the active impulse wave 3.
Given the clear daily uptrend, Nasdaq-100 index can be expected to rise to the next resistance levels 30770.00 – top of the previous impulse wave 3.


 and iv), lower)