
The 2020 U.S. Election: A Snapshot of Where We Are Today
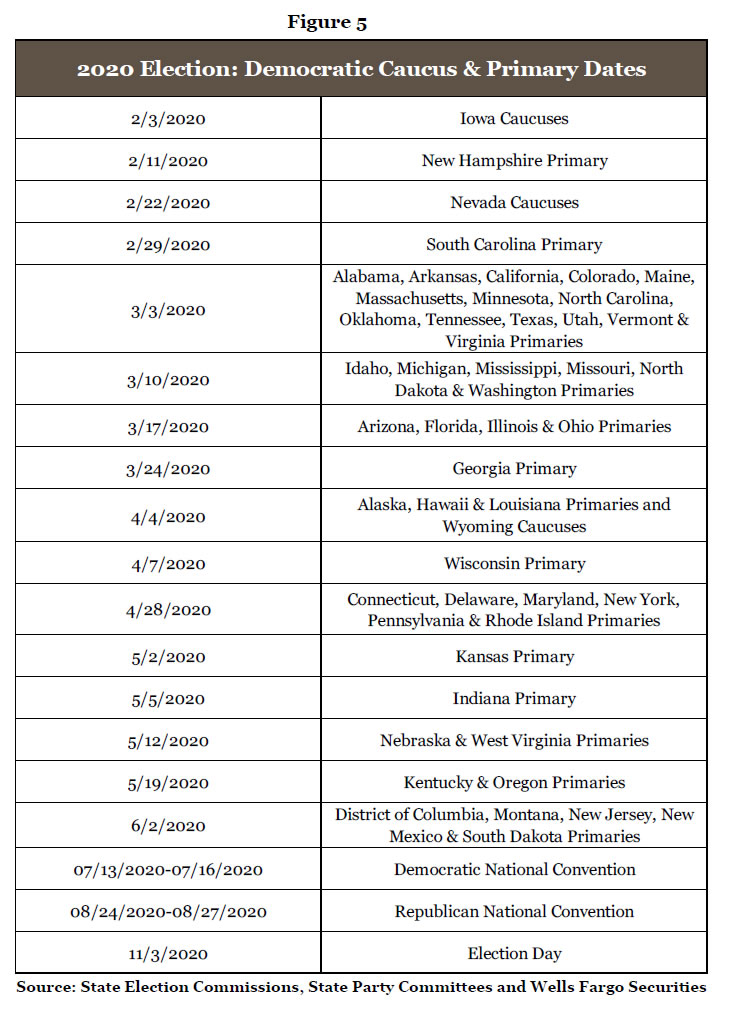
In this report, which is Part I in a series on the U.S. presidential election and its implications for the U.S. economy, we examine some of the key facts about the election as it currently stands. The campaign to be the Democratic nominee for the U.S. presidency is well underway at this point, with just 70 days until the Iowa caucuses, the first state to formally cast its lot in the primary season (a table of all the key primary/caucus/convention dates can be found on page 5). At the national level, the Real Clear Politics (RCP) polling average continues to have Joe Biden in the lead, with 29.8% of support (Figure 1). It has Bernie Sanders at 19.3% and Elizabeth Warren close behind at 18.5%. Pete Buttigieg rounds out the top four at 7.8%. Combined, these four candidates account for about three-quarters of the total share at the national level, with 13 other candidates accounting for the remaining quarter.

Interestingly, betting market odds look a bit different than each candidates’ respective shares in the national polling average. For example, on PredictIt, one leading market-based prediction platform, Elizabeth Warren has the highest implied chance of winning the Democratic nomination at 24%, followed by Pete Buttigieg at 22%, Joe Biden at 21% and Bernie Sanders at 16%. Perhaps one explanation for this discrepancy is that the polling looks somewhat different in the early primary/caucus states than it does at the national level. In Iowa, for example, Pete Buttigieg is in the lead according to the RCP polling data, with Biden, Warren and Sanders tightly clustered behind him. Markets may be assuming that early success for candidates like Buttigieg or Warren in Iowa could subsequently lead to a boost in support nationwide. In contrast, Biden’s polling numbers are not as strong in the first couple states, but given his strong national support some of the later states look much more favorable. For example, in South Carolina, the fourth state to vote, his RCP average is 35.3%, double the next closest candidate (Warren).
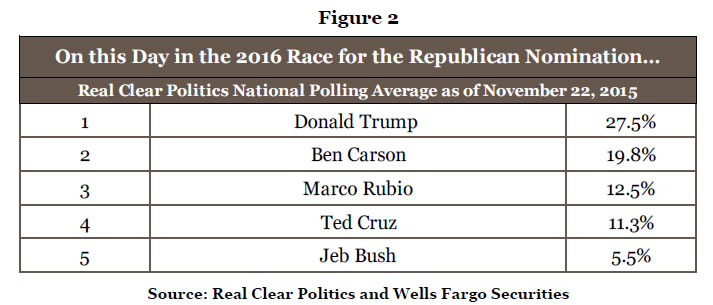
Early success has at times been a good predictor of the eventual nominee, such as when Barack Obama defeated Hillary Clinton in the 2008 Iowa caucuses. That said, early success is no guarantee of victory. At this point in the similarly crowded Republican primary for the 2016 presidential nomination, Donald Trump’s national polling support was comfortably above the next three closest candidates in the race (Figure 2). Yet, the Iowa polls were closer at that point, and Ted Cruz would continue to gain ground in the next couple months. Ted Cruz would eventually narrowly defeat Trump and Marco Rubio in Iowa, but Trump would go on to have success in many of the following states and ultimately claim victory.
For President Trump, the reelection strategy is likely fairly straightforward: strive to recapture and expand upon the 304 electoral votes that gave him the presidency in 2016. On the Democratic side, there are obviously numerous electoral outcomes that could get the nominee the 270 electoral votes necessary to win. A key to Trump’s success was his outperformance in some Midwestern states, and one potential path to the White House for the Democrats lies in reversing some of those gains. For example, Trump’s margin over Hillary Clinton in Michigan in 2016 was nearly 10 percentage points better than Mitt Romney’s differential with Barack Obama in 2012 (Figure 3). In Wisconsin, Trump’s improvement over Romney was nearly eight percentage points. If the Democratic nominee could win all of the states Hillary Clinton won while also recapturing Michigan, Wisconsin and Pennsylvania—three states that Trump won by less than one percentage point—that would give the nominee 278 electoral votes, enough to narrowly take the presidency.
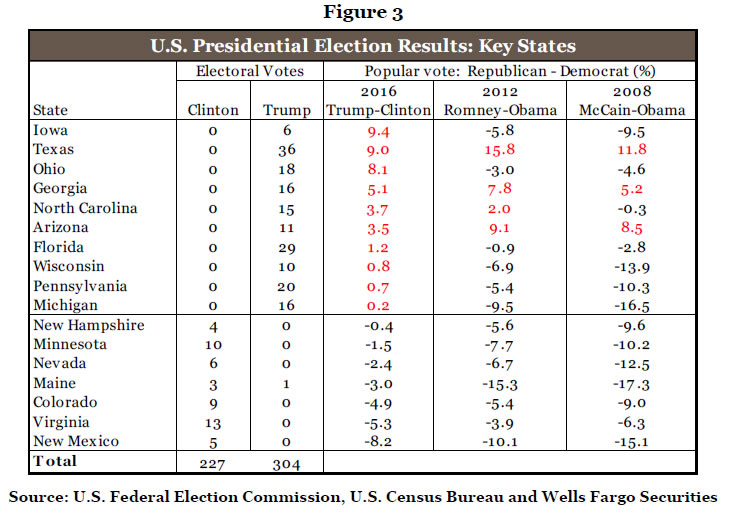
Another path for the Democratic nominee could be through some of the Sun Belt states that have drifted a bit more blue in recent years. For example, Hillary Clinton improved on Barack Obama’s 2012 margin in Texas by about seven percentage points, and she narrowed the Democratic loss in Arizona by 5.5 percentage points compared to 2012. Further improvement in these states provides a potential path to victory, but the hill is a bit steeper to climb. When looking at the actual margin of victory in 2016, Michigan, Pennsylvania and Wisconsin were all decided by less than one percentage point. In comparison, among the Sun Belt states of Florida, Arizona, North Carolina, Georgia and Texas, only Florida was decided by less than 3.5 percentage points.
The Presidency Gets the Attention, but Control of the Senate is Critical
While the race for control of the White House garners most of the attention, control of the U.S. Senate will be nearly as important to the policy outlook. Part of what made the 2016 election such an inflection point for financial markets and the economy was that it was the first time Republicans controlled the House of Representatives, the Senate and the White House since 2006. This unified control allowed President Trump and Republicans in Congress to pass some major legislation, such as the Tax Cuts and Jobs Act, without support from the opposition party. At present, Republicans maintain a majority in the Senate, with a split of 53 Republicans, 45 Democrats and two Independents. Both of the Senate Independents caucus with the Democrats (one of them, Bernie Sanders, is running for the Democratic presidential nomination), making the de facto split in the Senate 53-47. Thus, if the Democrats were to win the White House, they would need to net at least three Senate seats to win control of the upper chamber (when the Senate is split 50-50, the Vice President casts the deciding vote).
Every two years, one-third of the Senate is up for re-election. At first blush, the 2020 Senate map looks favorable to the Democrats. There are 23 Republican-held seats up for re-election compared to 12 Democratic-held seats, ostensibly giving the Democrats more opportunities to flip seats. However, of the 23 seats the Republicans are defending, 15 are in states that Trump won by 14 percentage points or more in 2016, a significant margin that will be difficult for the Democratic opposition to overcome. Of the remaining eight Republican seats, six are in states Trump won by at least 3.5 percentage points. While some of these states may be more within reach for the Democrats, they are still far from a slam dunk. Consider that of the four states Trump won by less than 1.5 percentage points (Michigan, Pennsylvania, Wisconsin and Florida), none have a Republican Senator running for re-election in 2020.
There are only two Republican Senators up for re-election in 2020 from states won by Hillary Clinton: Cory Gardner of Colorado and Susan Collins of Maine. Complicating matters further, one of the 12 seats Democrats have to defend is Alabama, which ended up with a Democratic Senator after a hotly contested special election in 2017. Trump won Alabama by nearly 30 percentage points, and if Democrats were to lose this Senate seat in 2020, they would need to pick up a net four seats elsewhere to take control of the Senate, assuming they also win the White House. At present, PredictIt markets have the implied probability of Republicans maintaining control of the Senate at roughly 66%.
Again, the critical thing to remember is that the policy outlook is not just about the White House. If, hypothetically, Democrats win the White House but fail to win back control of the Senate, the prospects for major progressive policy goals, such as Medicare for All, dim significantly. Conversely, if one party were to win both chambers of Congress and the White House, the prospects for major legislative change would improve dramatically. Most of the major pieces of legislation in the past decade, such as the Affordable Care Act, Dodd-Frank and the Tax Cuts and Jobs Act, were passed during periods of unified government, and we do not think this pattern is a coincidence.
The House of Representatives: Democratic Defense
Unlike the Senate, the House of Representatives is currently controlled by the Democrats, and in 2020 Republicans will be seeking to regain the majority that they most recently held from 2017-2018. The House is comprised of 435 members, and the entire House is up for reelection every two years. At present, there are 233 Democrats, 197 Republicans, one Independent and four vacancies. The vacancies are split evenly between two previously Democrat-held seats and two Republican-held seats. Depending on whether you count these seats, Republicans need to net either 19 or 21 seats in the House to gain the 218 seats needed for a majority. While this is certainly doable (Democrats picked up a net 40 seats in the 2018 midterms), the net change in House seats is usually smaller in presidential election years than it is in midterms. The average net change in House seats over the last six presidential elections is seven, and majority control of the House of Representatives has not switched parties in a presidential election year since 1952.1
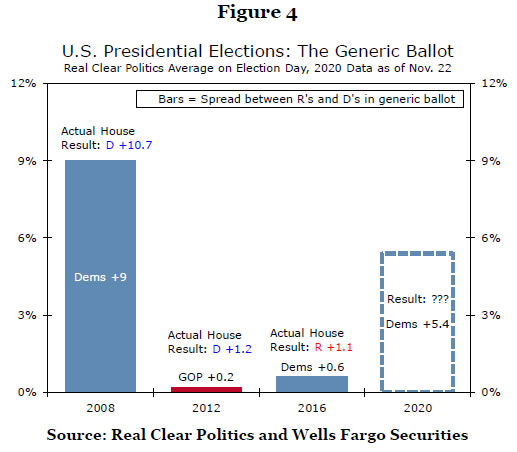
One tool utilized by political analysts to measure the general state of the race for control of the House is generic ballot polling. Generic ballot polling asks respondents whether they would vote for a Republican or Democratic for Congress, without actually using specific candidates. Figure 4 shows the RCP generic ballot polling average as of November 22, as well as the average position on Election Day in the past three presidential cycles. As can be seen, the generic ballot polling average has come within a couple percentage points of the actual House popular vote margin in the past few presidential elections.2 In 2008, Barack Obama won the White House, and helped House Democrats win the nationwide popular vote by about 11 percentage points, netting 21 seats. More recently, the House popular vote margin nationwide has been closer in presidential election years, and the number of seats gained or lost much smaller. At the moment, Democrats have a more favorable spread by this measure than they have had in the last two cycles, though it is still well below 2008 levels. At present, PredictIt markets have the implied probability of Democrats maintaining control of the House of Representatives at roughly 75%.
With just two months until the Iowa caucuses, the Democratic field running for the presidential nomination has begun to narrow. But the race remains quite competitive, with several candidates still in the hunt. While control of the White House will obviously have implications for economic policymaking in the years ahead, we encourage our readers to also remain cognizant of the outlook for control of the House and Senate. In our view, unified control of Congress and the White House is far more likely to yield major pieces of legislation than divided government would. With that in mind, our next report will focus on the economic policy proposals of some of the leading Democratic candidates, as well as what a second term for President Trump might look like.
1 “Majority Changes in the House of Representatives, 1856 to Present.” United States House of Representatives.
2 Bear in mind that, unlike in some parliamentary systems, winning the national popular vote at the Congressional level does not necessarily translate directly into a majority. The ‘first-past-the-post’ system, as well as the drawing of Congressional districts, can impact the actual number of seats won. Generally speaking though, the popular vote margin is a decent measure of seats captured.


