
U.S. Highlights
- U.S. stock markets recorded their worst performance since the financial crisis in the first quarter, with the S&P 500 and the Dow Jones falling 20% and 23%, respectively.
- Confirmed coronavirus cases now stand in excess of one million globally and have breached the 200k mark in the U.S. For context, there are now more confirmed COVID-19 cases in the state of New York alone than in all of China.
- The economy lost 701k jobs and the unemployment rate jumped to 4.4% in March. The data likely understate the extent of the crisis. The back-to-back record surges in weekly jobless claims, which topped 6.6 million last week, have set the stage for employment numbers to considerably worsen in April.
Canadian Highlights
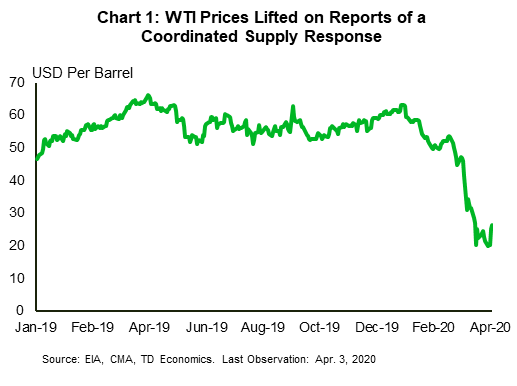
- Market sentiment stabilized relative to past weeks, leaving the S&P/TSX Composite up 2%. Oil prices were volatile again, up on signals of a potential coordinated supply reduction.
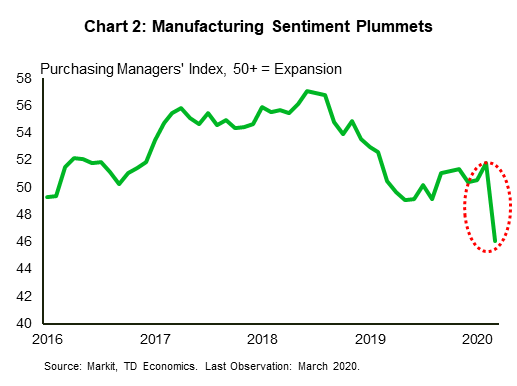
- Statistics Canada’s releases were from the pre-COVID-19 time period. Instead, we shifted our attention to March’s weak auto sales report and the slump in Markit’s manufacturing PMI.
- Finance Minister Morneau also announced further details on the Canada Emergency Wage Subsidy Program.
U.S. – In the Eye of the Storm
Following the worst performance since the financial crisis in the first quarter – the S&P 500 and the Dow Jones Index fell 20% and 23%, respectively – investors were looking for a better start to the second. Markets entered the week making headway, but sentiment soured midweek on warnings about the toll of the pandemic. Hopes for a truce in the oil price war between Russia and Saudi Arabia later helped brighten the mood and drove both oil and equity indexes higher, but the stock market gains were not to last, with grimmer-than-expected employment numbers weighing on sentiment Friday.
On a global scale, the coronavirus outbreak has yet to show any signs of slowing down. This week saw the largest single-day increase in new confirmed cases with over 80,000 cases added on Thursday. The number of confirmed cases now stands in excess of 1,000,000 worldwide, while fatalities have breached 50,000. On the domestic front, the U.S. continues to see an exponential rise in new cases and has become the global epicenter of the pandemic. The nationwide case count has crossed the 200,000 mark this week, led by a continuous surge in the state of New York which has now surpassed China’s total number of cases (Chart 1).
The rapid escalation in coronavirus cases is increasingly pushing state and local authorities to implement restrictive measures. As of Friday, at least thirty-eight states and D.C. have moved to implement stay-at-home orders, with Florida and Georgia among the latest to join the chorus. With large swaths of the American economy at a standstill, glimpses of the virus’ economic toll have started to come through in data for the month of March released this week.
The ISM Manufacturing Index fell into contractionary territory at 49.1, while the Non-Manufacturing Index dipped to 52.5 from 57.3 in the month prior. The non-manufacturing survey was artificially held up by a sharp increase in supplier-orders. But, rather than signaling strong demand, this was an indication of supply-disruptions related to the virus. Other sub-indexes fell in the month. Similarly, vehicle sales plunged 32% month/month. Employment data showed the economy lost 701,000 non-farm payrolls. Meanwhile, the unemployment rate rose to 4.4%, marking its largest monthly increase since 1975 (Chart 2).
As eye-opening as they are, these early readings still heavily understate the extent of the current crisis. In fact, jobless claims rose to unprecedented highs for the second straight week, with 6.6 million people applying for unemployment benefits in the week that ended on March 28th. These levels of claims, if maintained through the month of April, will push the monthly unemployment rate well into the double digits.
On the bright side, the response from policymakers has come in spade in recent weeks. It ranges from rate cuts to near-zero and a slew of emergency lending programs from the Fed, to a historical $2.2 trillion fiscal package which Congress enacted last Friday. More assistance, particularly for state and local governments at the forefront of the response effort is likely to come in the weeks ahead. This is needed as state and local governments are seeing virus related expenses surge at the same time that revenues are plummeting.


Canada – Oil Takes Center Stage, Data Receives Little Attention
Compared to the roller coaster ride of the past few weeks, this was a relatively quiet week for Canada. The S&P/TSX was up 2% on the week (as of 10:30 AM), although it followed its global peers lower today. The Canadian dollar remained stable at 71 cents, and bond markets have calmed, with government bond yields only little changed from last week.
Oil markets were more volatile. Reports of storage capacity running out and plummeting gasoline demand initially sent oil prices lower. Then came announcements that a coordinated production cut among some large producers may be forthcoming. The North American benchmark price now sits close to US$27 (Chart 1), up nearly 20% on the week. That said, the potential supply response (or lack thereof) will become clearer following OPEC+’s emergency meeting on Monday. The scale of demand destruction will require an unprecedented supply cut to result in meaningful price acceleration.
On the data front, the main releases belonged mostly to the pre-COVID-19 era. Real GDP for January increased a modest 0.1%, but lacked breadth across the industries. Statistics Canada’s international trade for February was decent, with export volumes were up a solid 2.7%. However, both sides of the ledger were disproportionately driven by the volatile aircraft category. Releases pre-dating March will continue to be brushed off, and we expect the drop off in activity in that month to pull quarterly growth negative.
Instead of the regular releases, more attention was paid to Wednesday’s auto sales report. The disappointing release showed a 48% (m/m) decline in sales and offered a preview of things to come in the retail sector. On the manufacturing side, Markit’s manufacturing PMI for March also showed a sharp contraction in sentiment, with the index dropping from 51.8 to 46.1 (Chart 2). Meanwhile, we also received some preliminary housing data form the regional real estate boards. Calgary, Vancouver, and Toronto all saw sales decline in March. Notably, Vancouver and Toronto’s reports cited that weakness was concentrated in the second half of the month – when COVID-19 related “sudden stops” began to spread. Looking ahead, April’s data is likely to see even larger pull-backs of activity.
In our latest forecast update, we incorporated a 9.9% rebound in Q3, following a record 24.8% contraction in the second quarter. This forecast is highly contingent on the duration of containment efforts and the policy responses to offset the impact of those necessary containment actions. Policymakers have been swift in their responses, and on Wednesday, finance Minister Morneau announced details of the Canada Emergency Wage Subsidy program. All businesses experiencing a 30% drop in revenues will be eligible for a 75% wage subsidy. We expect these policies to be supportive, but their efficacy will become clear over the next few months – and the roughly six week delay for first payments in particular may be a challenging obstacle for the most hard-hit businesses. Despite some stabilization in sentiment, we remain cautious and expect that risks are still tilted to the downside – with the ultimate duration of containment measures the key wildcard.
U.S: Upcoming Key Economic Releases
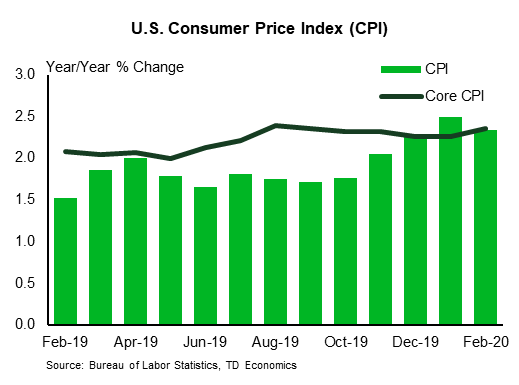
U.S. Consumer Price Index – March
Release Date: April 10, 2020
Previous: 0.1% m/m, 2.3% y/y
TD Forecast: -0.4% m/m, 1.6% y/y
Consensus: -0.3% m/m, 1.6% y/y
We expect the overall CPI to be down sharply due to a plunge in gasoline prices (TD: -0.4%), but the core reading will probably be relatively weak as well (TD: 0.0%), due largely to COVID-19 effects. Within core, we expect declines in airfares, lodging away from home (mainly hotels), and apparel. Our forecast implies a drop in the overall 12-month change to 1.6% from 2.3%. We expect the 12-month change in the core index to slow to 2.1% from 2.4%.
Canada: Upcoming Key Economic Releases
Canadian Business Outlook Survey
Release Date: April 6, 2020
The Bank of Canada’s Business Outlook Survey (BOS) for Spring 2020 is unlikely to capture the impact of COVID-19 on business sentiment owing to the timing of the interview process. Last year’s survey was conducted between February 19-March 13; firms may have been making contingencies through this period, but widespread flagging of consumer demand did not take hold until the end of that timeframe. This should result in some erosion (but not blowout) of BOS measures, including a negative reading on the composite BOS indicator. Other measures should show weaker hiring and investment intentions, and softer inflation expectations.

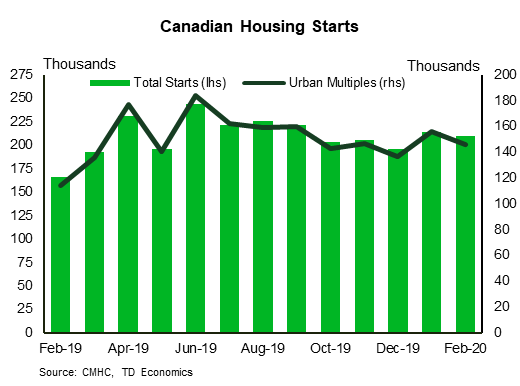
Canadian Housing Starts – March
Release Date: April 8, 2020
Previous: 210k
TD Forecast: 180k
Consensus: NA
March housing starts will give an early read on the impact of COVID-19 on the construction sector in Canada, with TD looking for a decline to a 180k annualized pace. Construction workers have been deemed essential in most jurisdictions that have closed non-essential firms, but anecdotal evidence suggests many are operating with reduced headcounts if it all. Furthermore, small business confidence in the construction industry fell to record lows in March which suggests a significant headwind to near-term residential investment.
Canadian Employment – March
Release Date: April 9, 2020
Previous: 30k, unemployment rate: 5.6%
TD Forecast: -350k, unemployment rate: 7.3%
Consensus: NA
The March LFS will capture an economy in rapid transition from full employment to one experiencing double-digit unemployment rates. Over 900k Canadians filed for unemployment benefits during the reference week that ended March 21st, although the temporal distribution of claims (and LFS surveying) within that week will have a significant impact on the headline print. Accordingly, we pencil in just 350k jobs lost during the month, which would represent the largest decline on record, but note there is scope for a significantly weaker print. A -350k print would push the unemployment rate to 7.3% and while hourly wage growth should hold near 4% y/y, we expect to see some pullback in weekly wage growth owing to fewer hours worked.


