
U.S. Review
April Employment Plummets
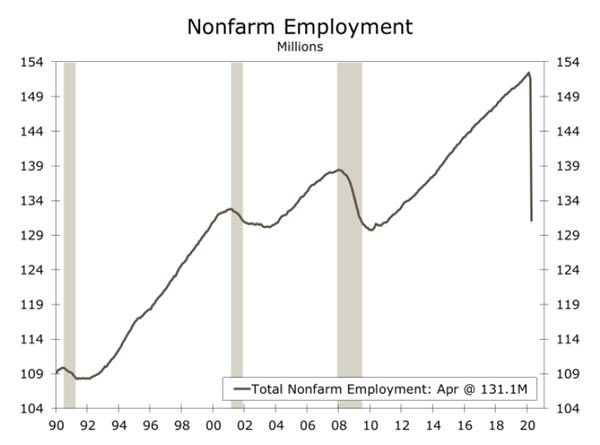
- April nonfarm payrolls confirmed what we already knew—the labor market is collapsing. By the survey week of April 12, net employment had fallen by 20,500,000 jobs.
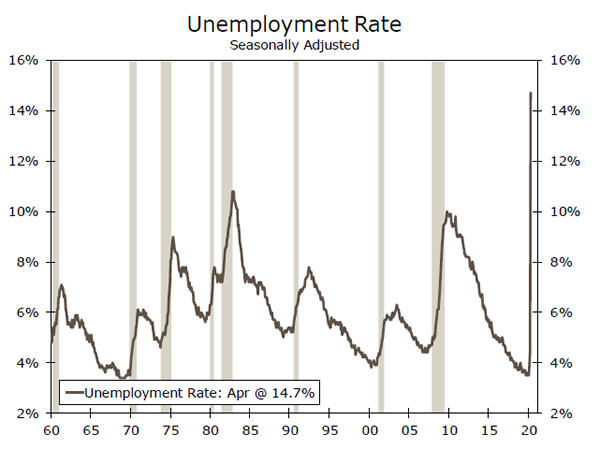
- The unemployment rate jumped 10.3 percentage points to 14.7%, the highest since World War II, but the BLS suggested the true rate was near 20%.
- The employment-to-population ratio dropped 8.7 percentage points to 51.3%, the lowest on record.
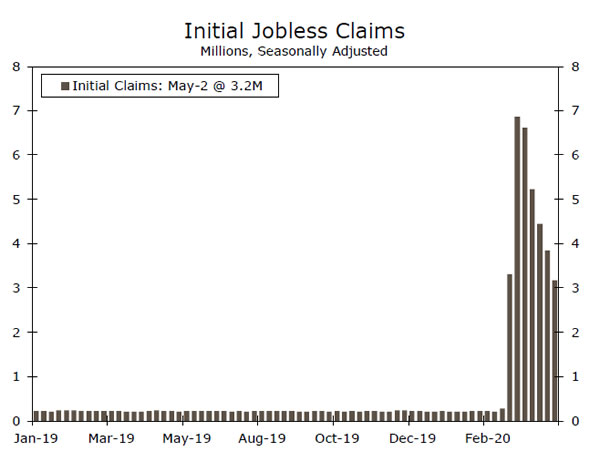
- The May nonfarm payrolls report will be awful as well. Initial jobless claims, a proxy for layoffs, have continued to pour in, reaching a cumulative 33 million.
April Employment Plummets
April nonfarm payrolls confirmed what we already knew—the labor market is collapsing. By the survey week of April 12, net employment had fallen by 20,500,000 jobs, more than ten times larger than the previous worst month on record. COVID-19 wiped out nine years of job gains in a single month, as the 131 million Americans on payrolls was the lowest since February 2011. The unemployment rate jumped 10.3 percentage points to 14.7%, the highest since World War II. The BLS noted, however, that many who were out of work because of the coronavirus were counted as merely absent rather than unemployed. It estimates that a proper classification would have pushed the U-3 unemployment rate even higher, to around 20%.
There was also an exodus from the labor force, which contracted by a record 6.4 million. Many who lost their job were unable or unwilling to look for a new one, either because their industry remains largely shutdown, they do not feel safe returning to the workplace, they are taking care of children who are out of school/daycare or they are dis-incentivized to look while they receive augmented unemployment insurance under the CARES Act. This brought the labor force participation rate down by 2.5 percentage points to 60.2%, the lowest since 1973. A broader measure of unemployment, the U-6 underemployment rate, rose to 22%. Perhaps the clearest measure of devastation, however, is the employment-to-population ratio, which dropped 8.7 percentage points to just 51.3%, the lowest on record.
No industry was spared from the devastation. Leisure & hospitality payrolls have been cut nearly in half since February, and collapsed 7.7 million in April. Other sector losses: manufacturing (-1.3M), construction (-975K), retail trade (-2.1M), professional & business services (-2.1M), education & health (-2.5M) and government (-980K).
The above-consensus 4.7% jump in hourly earnings, which is a simple average that does not adjust for compositional shifts, was merely a consequence of the hollowing-out of lower paid industries. For example, the average hourly wage in leisure & hospitality was $16.86 in March, far below the economy-wide average of $28.67. The COVID-19 economic crisis is disproportionately hurting women, minorities and those without a college degree.
The May nonfarm payrolls report will be awful as well. Initial jobless claims, a proxy for layoffs, have continued to pour in, reaching a cumulative 33 million. Some of these workers will be rehired, but gross hiring is freezing up across a broadening array of industries. If there is any reason to be optimistic, it is this: of the 20 million jobs lost in April, more than 18 million were reported as temporary layoffs. In one theory, as economies re-open—and with the PPP providing incentive for firms to re-hire by the end of July— many of these workers could be recalled. This scenario is perhaps driving the turnaround in equity markets, but we fear it is too optimistic. The scars of 20 million job losses, to the economy and to society, are hard to overstate.
U.S. Outlook
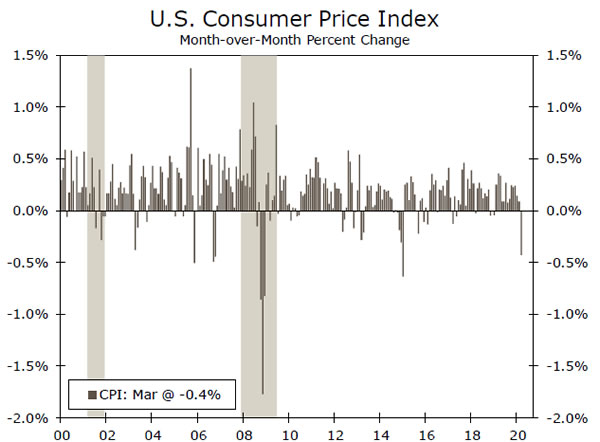
CPI • Tuesday
The factors that influence prices are all over the place. In the service sector and in manufacturing, purchasing managers are reporting some of the longest wait times on record for supplier deliveries, as the crisis is making it impossible to get some of the things they need. Ordinarily that scarcity would push up prices.
Yet at the same time, many commodity prices are falling as worries about a collapse in demand weigh on the outlook. In the case of oil prices, the demand problem is further complicated by a price war between the Saudis and the Russians that pushed the price of oil briefly into negative territory and has kept prices low.
On Tuesday of next week, we will get a look at the consumer price index for April. A decline in prices during the month seems likely, although expectations about the magnitude of the decline are all over the board.
Previous: 1.5% Wells Fargo: 0.3% Consensus: 0.4% (Year-over-Year)
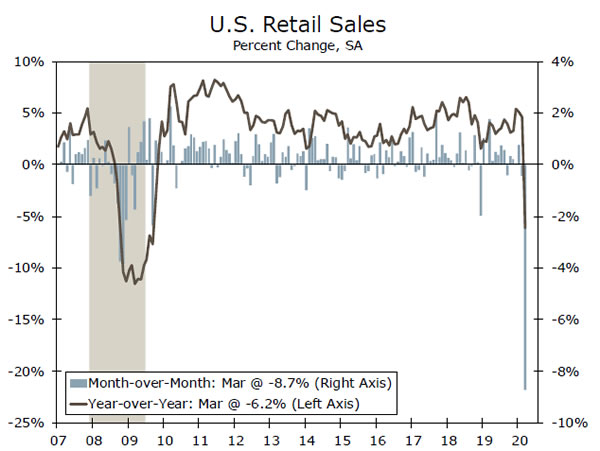
Retail Sales • Friday
Retail sales plunged in the middle of March, as the country went into lockdown. The few places that stayed open, like general merchandise marts, warehouse clubs and grocery stores, had a banner month as panic selling resulted in record monthly increases. Most other types of stores reported their worst months on record.
However, the records may not last long. With some stores shuttered for the entire month of April, the register receipts will likely be grim. The cratering in sales during April could mark the low point of the cycle as even a gradual reopening in May offers scope for at least some kind of an increase. If the government’s preferred forecasts are right, and the virus retreats quickly this summer, the broader reopening and pent-up demand suggest the retailers who have been able to survive the shutdown should see sales normalize in the second half of the year.
Previous: -8.7% Wells Fargo: -12.3% Consensus: -11.0% (Month-over-Month)
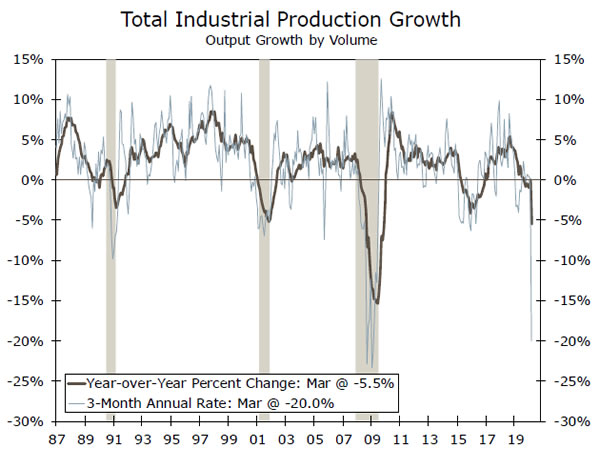
Industrial Production • Friday
Industrial output came to a screeching halt in March, as many factories barred their doors starting in the middle of the month amid the outbreak. Industrial production posted the biggest monthly decline since demobilization after the Second World War.
With some mines and many factories not running at all in April, another serious decline is in the cards for April. However, here too a gradual reopening in May suggests that April could mark the low point for output.
The second half recovery will be limited not only by diminished confidence in the manufacturing sector, but also by ongoing supply chain constraints as the knock-on effect of supply chain disruption continues to frustrate purchasing managers and hold up deliveries.
Previous: -5.4% Wells Fargo: -10.7% Consensus: -11.4% (Month-over-Month)
Global Review
Global Economic Downturn Intensifies
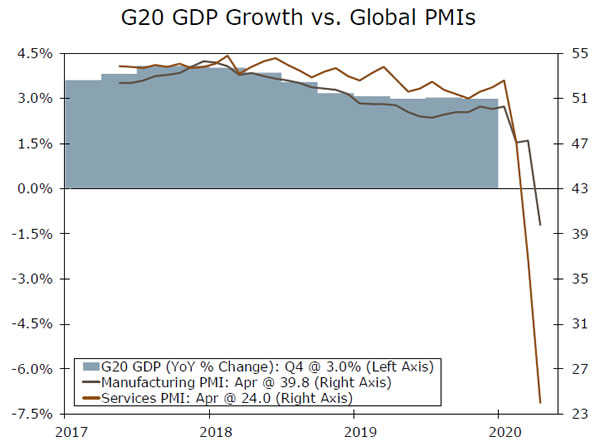
- The past week saw further evidence of a more widespread and faster downturn across the global economy.
- Canadian March employment and Eurozone March retail sales both fell sharply. In addition, a much larger fall in the April global services PMI (to 24.0) than in the manufacturing PMI (to 39.8) suggests the negative effects from COVID-19 are most noticeable in the service sector.
- The Bank of England held policy steady, but said a large decline in U.K. GDP was likely in H1-2020, suggesting a growing risk of further quantitative easing before too long.
Bank of England on Hold…For Now
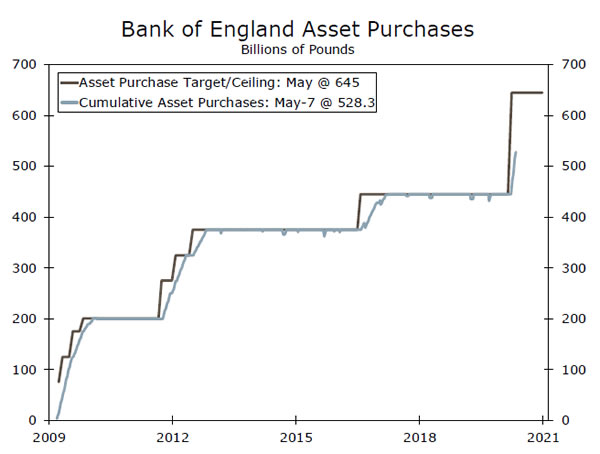
After a particularly active March which involved, among other things, rate cuts and an expansion of quantitative easing, it has been a period of relative calm for Bank of England (BoE) monetary policymakers in April. At its May meeting the BoE held policy steady, keeping its Bank rate at 0.10% and maintaining its overall asset purchase target at £645B. It was not complete calm though, as the BoE said Q2 GDP could fall as much as 25% quarter-overquarter, and said it will act as needed to deliver monetary and financial stability, hinting at more quantitative easing soon.
In part, perhaps the BoE is monitoring the effect of its existing policy measures before deciding on its next move. Since its March announcement, the BoE has conducted around £83B of asset purchases, helping keep bond yields well contained, while lending through its term funding scheme has so far amounted to around £11.oB. However, the economic news is set to get worse before it gets better while, at the current pace, the BoE will hit its asset purchase target by early Q3. As a result, we believe the risks remain tilted toward further quantitative easing soon.
Canadian Labor Market – From Bad to Much Worse
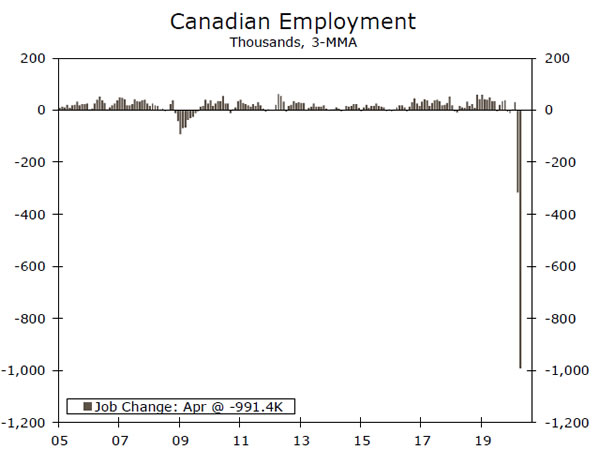
Canada’s labor market, similar to its U.S. counterpart, has gone from bad in March to much, much worse in April as the effects of the COVID-19 lockdown on the economy have become more apparent. The month of April saw a record 1,994,000 decline in employment, more than the approximately one million jobs lost in March, although less than forecast. Around three-quarters of the job losses were full-time while around one quarter were part-time. In addition job declines were concentrated in the private sector, where jobs fell 1,874,000, mostly in the service sector. Finally, the jobless rate jumped to 13.0%, just below the peak seen in 1982.
Another notable aspect of the report was the decline in total hours worked, an indicator which gives an early (if only approximate) insight into GDP trends. For April, total hours worked slumped 14.9% month-over-month, following a 15.1% decline in March. The level of hours worked in April is some 24% below the Q1 average. Clearly, the Canadian economy is in a deep hole—we forecast a 25% quarter-over-quarter annualized contraction in Q2 GDP, but acknowledge the risk is for an even larger decline.
European Consumers Stop Spending
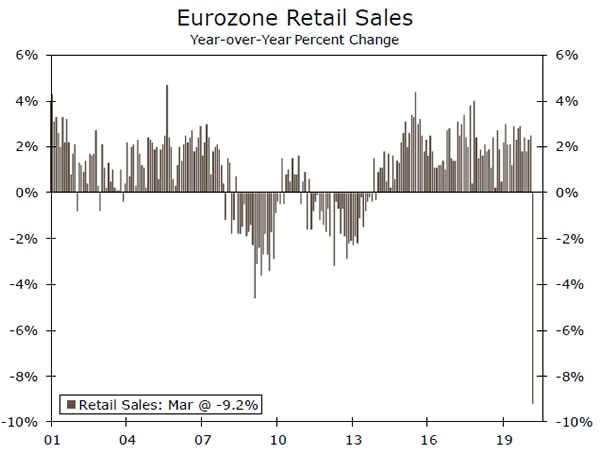
The Eurozone recently reported a large drop in Q1 GDP, while this week’s data confirmed that a significant portion of that weakness was concentrated in the consumer sector. Eurozone March retail sales fell 11.2% month-over-month, easily the largest decline in data back to 2000. Clothing and footwear sales, along with automotive fuel and specialty stores, saw especially large declines, although there were modest gains in food, mail order and internet sales. Looking at national reports from the largest Eurozone economies, France, Italy and Spain all reported sales or spending declines of more than 15% in March, with only Germany reporting a “smaller” 5.6% fall in March retail sales. With lockdown measures extending through most of last month, we expect another sizeable fall in Eurozone retail sales in April.
Global Outlook
U.K. Q1 GDP • Wednesday
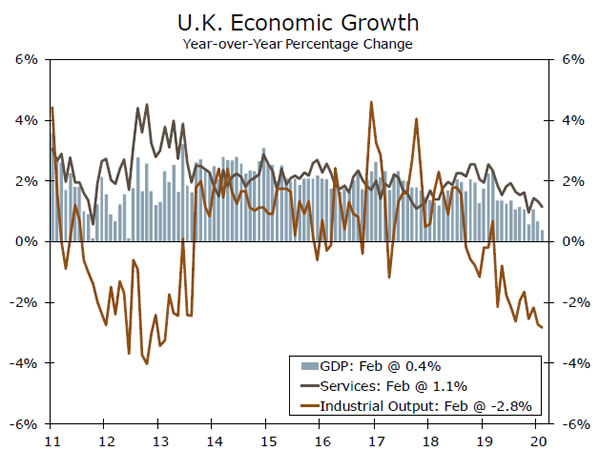
Next week’s U.K. Q1 GDP release will provide the most comprehensive indication yet of the intital economic damage inflicted by COVID-19. After a flat quarter in Q4-2019 and sluggish momentum in early 2020, U.K. GDP is expected to contract in Q1, we forecast for a 2.5% quarter-over-quarter decline. Given soft retail data, consumer spending is expected to fall 2.8%, while we also expect investment spending to decline.
In addition to Q1 figures, next week will provide an additional level of granularity with monthly GDP figures. U.K. March GDP is expected to fall 7.9% month-over-month, the largest monthly decline on record. The service sector, which accounts for almost 80% of the economy, is expected to fall 8.0% month-over-month, while industrial output should fall 5.5%. The sharp slump in March GDP should carry over into Q2, when another large quarterly decline is expected.
Previous: 0.0% Wells Fargo: -2.5% Consensus: -2.5% (Quarter-over-Quarter)
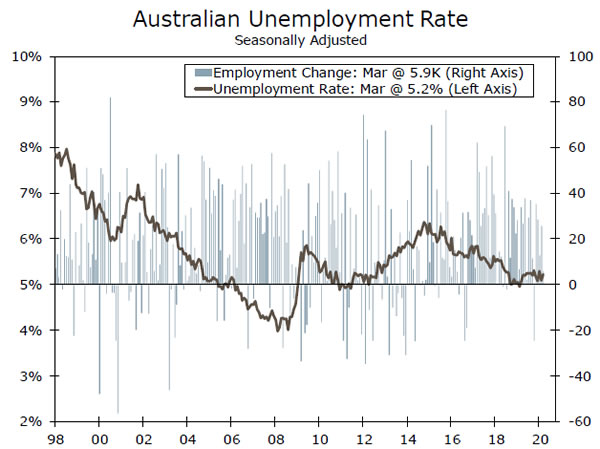
Australian Employment • Thursday
Australia’s April labor market report should provide the first concrete evidence of the negative impact of COVID-19 on the economy. The activity data so far in 2020 have shown little negative effect and, in fact, March retail sales showed a pre-COVID surge in spending. However, a sharp decline in March business sentiment portends significant economic weakness in Q2, which should be clearly reflected in the April job figures.
The consensus expects April employment to fall 550,000, which would easily be the largest monthly decline on record, while the unemployment rate is expected to jump to 8.3% (from 5.2% in March). In addition to these headline figures, the split between fulltime and part-time jobs, and the change in total hours worked, will provide further insight into just how soft the labor market was in April. That said, despite the softness in the labor market and economy, we expect monetary policy to stay on hold for now.
Previous: 5,900 Consensus: -550,000 (Monthly Employment Change)
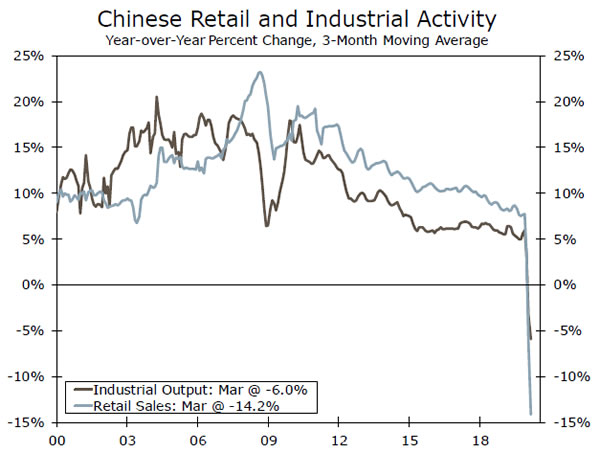
China Retail & Industrial Data • Friday
After being the first major economy to suffer a COVID-19 economic downturn, China now appears to be the first major economy showing a post COVID-19 recovery. The release of April retail sales and industrial output will provide insight into whether that is only a gradual economic recovery, or a somewhat faster rebound.
The recovery has been led by manufacturing, a trend which likely continued in April. Following declines in early 2020, growth in industrial output is expected to return to positive territory with a gain of 1.5% year-over-year. The retail sector is also expected to improve, although the recovery in the consumer sector remains more gradual. Retail sales are forecast to fall 5.9% year-over-year in April—a decline, albeit much less than the 15.8% fall in March. Overall, we expect positive quarter-over-quarter GDP growth in Q2, although we do not expect a full rebound from the Q1 GDP decline.
Previous: Retail Sales -15.8%; Industrial Output -1.1% Consensus: -5.9%; +1.5% (Year-over-Year)
Point of View
Interest Rate Watch
How to Finance the Gaping Deficit?
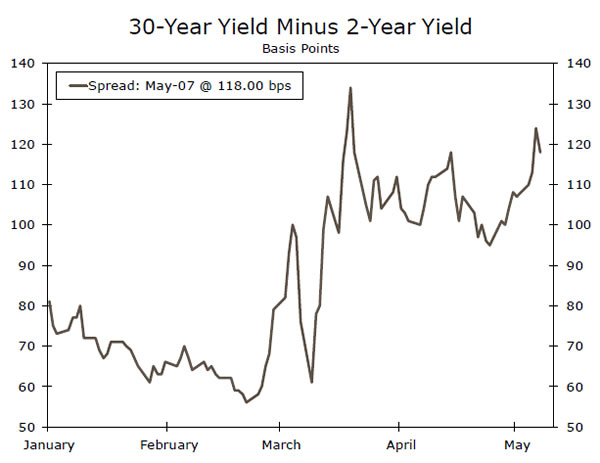
This week, the U.S. Treasury announced sizable increases to its auction schedule for coupon-bearing Treasury securities. We were on the higher side of the consensus, and yet the Treasury’s moves were even larger than we expected. The increases were especially large for longer-dated Treasury securities. The initial reaction to the changes was a steepening of the Treasury yield curve (top chart).
We expected the auction for the 10y note to increase $3 billion, but the Treasury went with a $5 billion increase. For the 20y bond, which is being reintroduced after a hiatus of several decades, the initial auction will be $20 billion. Some market observers thought Treasury might delay the introduction of the 20y due to Treasury market liquidity issues that arose in mid-to-late March for longerdated securities. We disagreed, but even then the $20 billion original issue far surpassed our expectation of $12 billion.
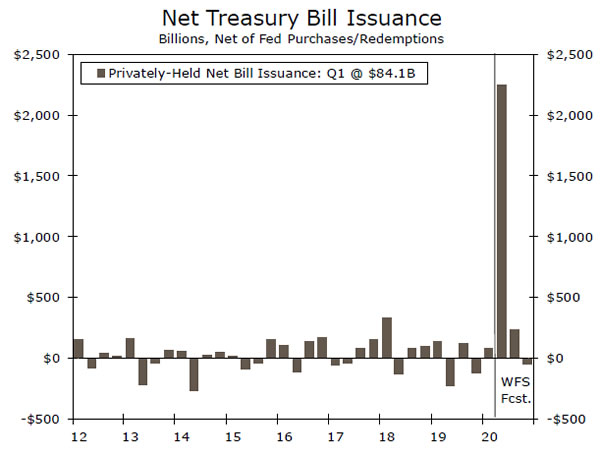
We expected Treasury to term out the debt over time, but these moves suggest it plans to do so even faster than we anticipated. However, even these significant increases to auctions are not enough to fully meet the anticipated financing need in the months ahead. As a result, Treasury bill issuance will need to pick up the remaining slack. We expect net T-bill issuance of $1 trillion in May and June, which would come on the heels of the $1.3 in April (middle chart).
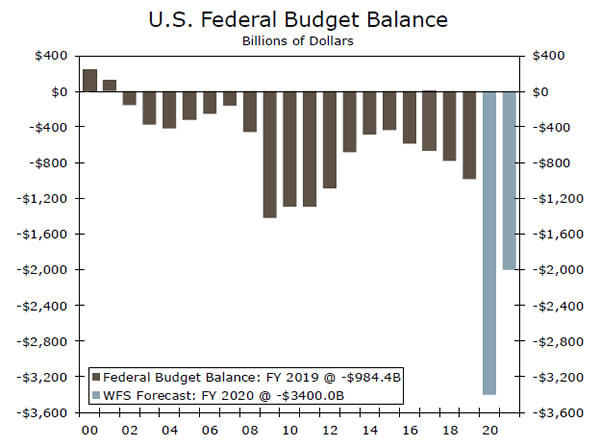
As if these eye-popping numbers are not enough, our FY 2020 budget deficit forecast is $3.4 trillion, followed by a $2.0 trillion deficit in FY 2021. We view the risks to our budget balance forecasts as clearly skewed toward bigger deficits and thus more Treasury issuance later this year.
Thus far, sizable Federal Reserve purchases have helped keep a lid on Treasury yields. At the peak, the Fed was buying $75 billion of Treasuries per day in mid-to-late March. Since then, the Fed has tapered its purchases to $8 billion per day. While we do not think the increase in Treasury supply will cause a runaway move in yields anytime soon, this week’s price action serves as a reminder that supply dynamics can still move the Treasury market.
Credit Market Insights
COVID Consumer Credit Crunch
Data released this week from the New York Fed provide a view of household balance sheets before the COVID-19 crisis. While the report provides a snapshot of credit reports as of March 31, it is unlikely to capture the potential increase in missed debt payments resulting from the pandemic, as these usually do not appear until a full statement period has passed.
In the first quarter, household debt stood at $14.3 trillion. The $155B increase from Q4 came almost entirely from mortgage debt, with a decline in credit card balances offsetting increases in auto and student loan debt. While declines in credit card balances are normal for Q1, Q1-2020 saw the largest quarterly decline on record, reflecting the sharp drop in March spending. These spending declines are likely to continue, particularly for big ticket items. In the NY Fed’s SCE Household Spending Survey, the average probability of making a large purchase in the next four months fell to series lows across almost every expenditure category. Moreover, it might be tough for consumers to access credit in the first place. The Fed’s Senior Loan Officer Opinion Survey reported a significant net fraction of banks tightening terms and standards on credit cards and other consumer loans. Even with typical credit purchases drying up, however, it is possible that we will see higher debt levels after this crisis. With incomes disappearing, many households may turn to debt to pay bills, or utilize new forbearance programs to delay debt payments.
Topic of the Week
Do We (Still) Have a Deal?
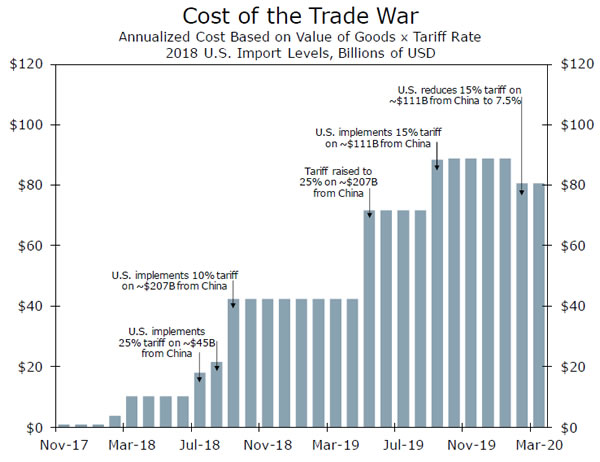
If you forgot, we do not blame you, but the United States and China are still in the midst of a trade war. The two nations came to a Phase One agreement earlier this year, but there are still many tariffs in place on both sides (top chart). President Trump threatened earlier this week to terminate the agreement if China does not adhere to its terms. However, the two nations had a call on Thursday, concluding “both countries fully expect to meet their obligations under the agreement in a timely matter.”
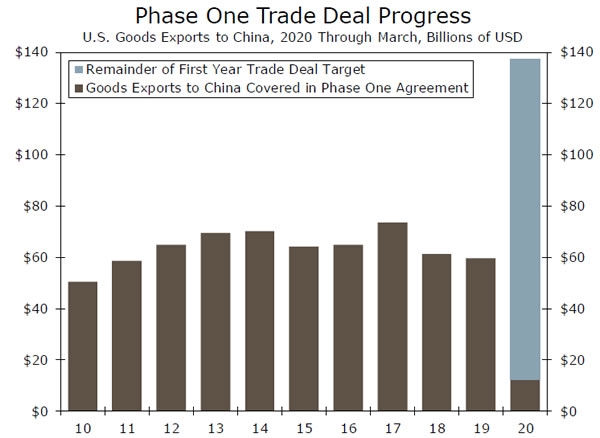
As a quick reap, the centerpiece of the deal was a commitment by China to buy an additional $200 billion of various goods and services, compared to 2017’s trade levels over the next two years. This included a $76.7 billion increase in 2020 alone, which equates to roughly $17.4 billion in additional purchases per month. If we account for the drop in Chinese imports from the U.S. last year, the deal calls for about a 130% increase in goods imports covered by the agreement from 2019 levels.
Many, ourselves included, thought these purchase targets were ambitious even before COVID-19 wreaked havoc on the global supply chain. The halt to global trade due to the coronavirus outbreak means Chinese purchases are far behind what is needed to meet year-end targets. Data this week showed Chinese exports rose 3.5% versus a yearearlier in April, but imports dropped 14.2%. We only have U.S. trade statistics through March, which showed total exports to China were down 23.5% compared to last year. In terms of the products covered by the agreement, China is about $22.2 billion, or more than halfway, behind its goods purchase target (bottom chart).
This matters today, because at a time when the U.S. economy is grappling with COVID-19, the reescalation of the trade war would further constrain businesses and households. Last year, the Federal Reserve Bank of New York found that U.S. tariffs on Chinese imports cost a typical U.S. household $831 annually. A reescalation would therefore increase that cost burden and hit consumers who are already in a vulnerable position.


