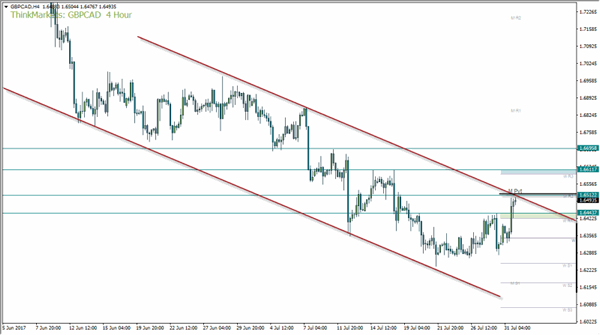
Technically, some of the CAD crosses appear to be over-extended from their bullish run which leaves them vulnerable to data which undermines the BoC’s tightening cycle. With raw materials and industrials yanking overnight, it may only take weak trade or employment on Friday to bring more of a correction.
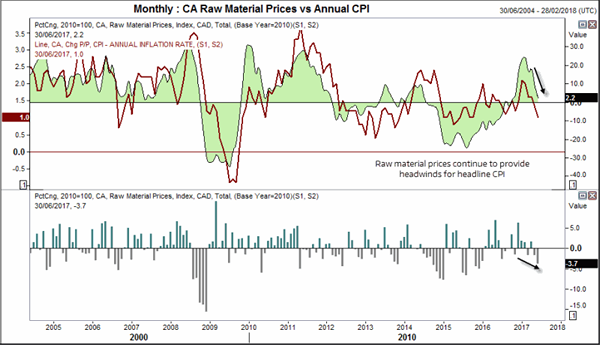
Raw material prices softened further in July by contracting -3.7%, its fastest ate since Dec ’15. This makes it the third contraction over four months and have dragged the annual rate to 2.2%, its lowest rate of expansion since October 2015.
Oil prices have played a large part here as the annual rate of material prices and WTI track very well. As there has been a rebound in oil prices, we expect the decline to provide a trough and perhaps even move higher in the next couple of months. Yet further out we cannot rule out an extension of softer prices as the rally with Oil has been largely due to short-covering over increased bullish interest, which suggests a limit to how high oil can rebound from here.
Industrial production also threw a curve ball into the mix by contracting by 1%, its heaviest decline since Dec ’14. Annually it expanded by 3.3%, its lowest in 5 months yet we’ll have to wait until next month to see if this is merely an outlier or the beginning of something more sinister.
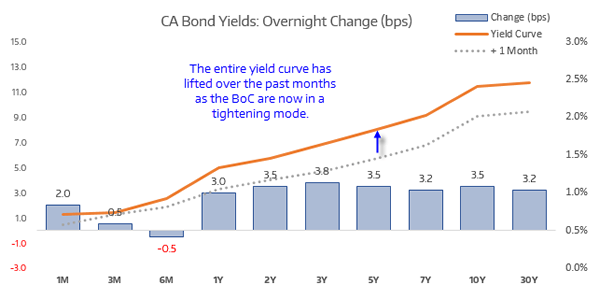
Data overnight throws another spanner in the works for traders. The Canadian economy has been making headway in recent months, at least by just enough to warrant a hike for the first time in 9 years. Bond yields have been moving higher in anticipation of a continued pickup in data, yet mixed signals from inflation reads may deter some the bullish bets. As data since their hawkish hike has been a little on the soft side and CAD crosses appear to be technically over-extended, we may be setting up for some counter-trend moves.
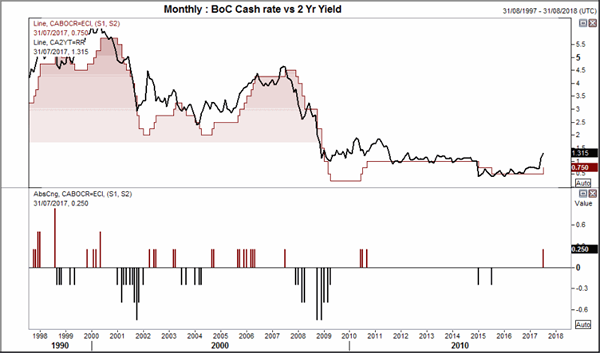
Bond markets suspect another hike or two may be on the way, judging from the acceleration of the 2yr yield. As inflation erodes the value of a bond, the fear of inflation (or a hike which is associated it) can send bond prices lower and yields higher. It is this added sensitivity to inflation which can make bond prices a leading indicator for policy changes and, whilst not perfect, can lead turning point between policy shifts. It is worth pointing out that they’re not so great at predicting the level of central bank rates but it can help with the general direction. For now, markets remain convinced BoC are in tightening mode and we now need hard data to justify the rise in yields over the coming months, or bonds will regain their lure and send yields lower.
EURCAD rallied overnight and has tested the upper channel. This area also coincides with the monthly pivot and weekly R2 which makes it an idea zone to monitor for both bullish and bearish signals; a break of such a level makes a decent bullish case, whereas a rejection form here could entice bearish swing traders.
As price respected and accelerated away from the weekly pivot, we favour an eventual upside break. Only a firm rejection of the monthly pivot would deter us from that bias, as a mild retracement from here could also be expected before a bullish break.