US stocks wavered as investors reacted to the latest corporate earnings by top companies like Alphabet and Microsoft. Alphabet, the owner of Google and YouTube, announced a 34% revenue jump to a record $55.3 billion, which was higher than the expected $51.6 billion. Its net profit surged by 162% to $17.9 billion. In the same quarter, Microsoft’s revenue rose by 19% to $41.7 billion while its earnings per share rose to $1.95. Other companies that have recently performed strongly are banks like JP Morgan and Goldman Sachs and asset managers like Blackrock and Blackstone. The earning season will continue today, with companies like ADP, Shopify, GlaxoSmithKline, and CME Group set to publish.
The Australian dollar dipped after relatively weak Australian inflation numbers. According to the Bureau of Statistics, the headline consumer price index declined from 0.9% in the fourth quarter to 0.6% in the first quarter. This decline was worse than the median estimate of 0.9%. The inflation rose from 0.9% to 1.1% on a year-on-year basis, lower than the expected increase of 1.4%. Meanwhile, the trimmed and weighted mean inflation rose by 1.1% and 1.3%, respectively. These numbers show that inflation is still below the Reserve Bank of Australia (RBA) target.
The price of crude oil dipped after a higher-than-expected increase in US inventories. According to the American Petroleum Institute (API), the average weekly stock rose from 436,000 barrels to more than 4.31 million barrels. Analysts were expecting the stocks to rise by 375k barrels. The Energy Information Administration (EIA) will publish its weekly inventory numbers later today. Oil also declined as the market reacted to news that OPEC+ had decided to increase production gradually despite a Covid resurgence in some countries like India. The members will begin the process of increasing production in the next three months.
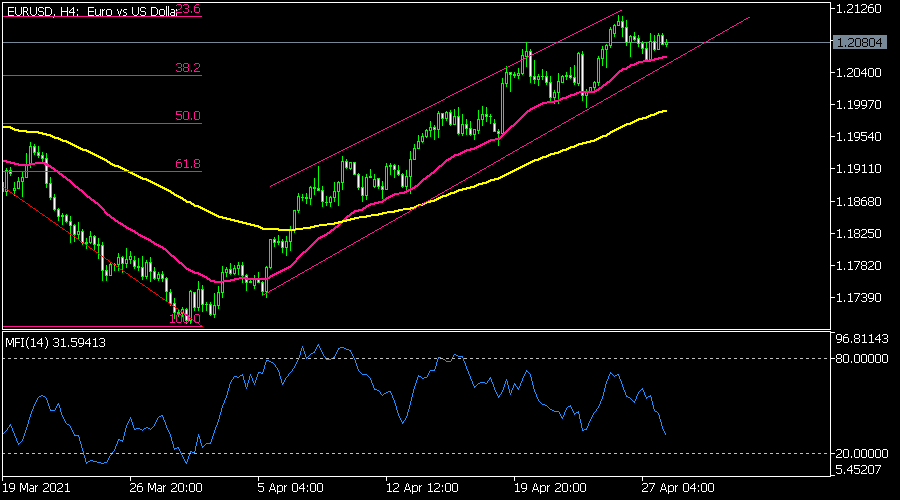
EUR/USD
The EUR/USD pair was little changed during the Asian session as the market waited for the latest Fed decision. It is trading at 1.2080, which is slightly below the highest point this week. On the four-hour chart, the pair is stuck between the ascending pink channel. It is also slightly below the 15-day moving average, which is a bullish scenario. The price is also between the 23.6% and 38.2% Fibonacci retracement levels. Therefore, the pair’s upward trend will remain if the price is above the short and longer-term moving averages.
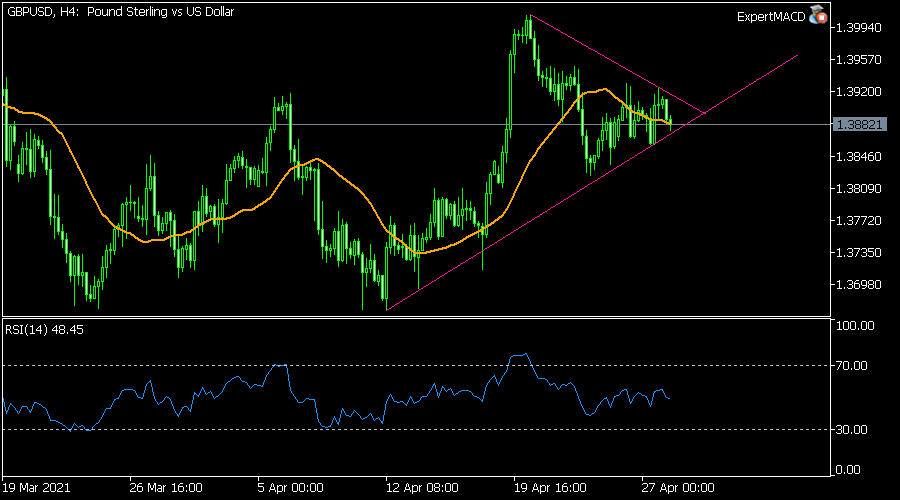
GBP/USD
The GBP/USD pair was little changed during the American and Asian sessions. It is trading at 1.3880, where it has been in the past few trading sessions. On the four-hour chart, the price has formed a triangle pattern and is also along the 25-day moving average. The Relative Strength Index (RSI) is between the overbought and oversold levels. With no economic data scheduled from the UK, the pair will likely see a breakout on either side before and after the Fed decision.
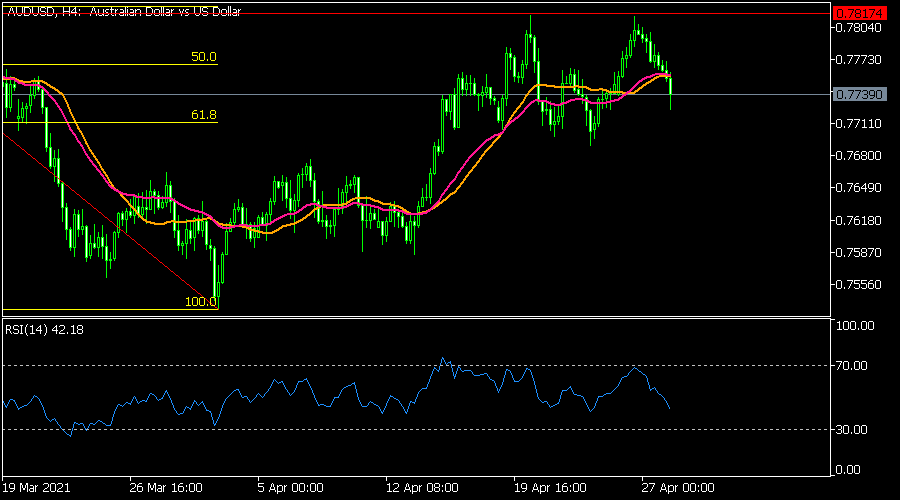
AUD/USD
The four-hour chart shows that the AUD/USD pair has formed a double-top pattern at 0.7814, which is slightly below the 38.2% Fibonacci retracement level. The pair has also declined below the 25-day and 15-day moving averages and is approaching the neckline of the double top at 0.7690. The pair’s RSI has also continued to decline. Therefore, it will likely continue falling as bears target the neckline of the double-top at 0.7690.