WTI’s price moved higher on Monday reaching over $64 per barrel in the US session. The price action was attributed to improved Chinese economic figures and the uplifted U.S. vaccination process confirming demand for the commodity could be enhanced by the world’s two largest economies.
WTI has been supported by elevated Chinese crude imports in the first quarter of the year after the mainland saw a rise in car sales, a recovery in local travel and a notable rebound in industrial activities. Analysts suggest that the current adverse circumstances in India are holding Oil prices back from moving even higher.
Moreover, OPEC’s oil output increased in April as higher supply from Iran countered involuntary cuts and agreed reductions by other members under a pact with allies. Increased output could be a sign of confidence for the Oil group as demand could be rising on a faster pace at this stage. Traders will be turning their attention to the American Petroleum Institute weekly stockpiles figure to be released on Tuesday’s US session and the U.S. Energy Information Administration be released on Wednesday. These readings can provide information on demand for the Oil market.
Moreover, Copper’s price is currently trading at new multiyear high prices and its demand from various countries that have managed to increase industrial activities has been solid throughout 2021
On Monday WTI bounced off the (S1) 63.00 support level and headed higher surpassing $64. If the buying trend continues to dominate the commodity’s price action then we may see a run higher to the (R1) 65.35 resistance level. This level was briefly tested last time in the past week thus remains very relative to recent price action. Higher we have noted the (R2) 66.45 resistance level that was last tested in March while even higher the (R3) 67.70 resistance line represents the highest price reached in 2021. In the opposite direction, as noted our first support is at the (S1) 63.00 while even lower the (S2) 61.75 support level could be the next stop in a downward trend line. Our lowest level for this report remains the (S3) 60.50 support level that was tested twice in April but was not breached to the downside. At the moment the RSI indicator remains above 50 which could imply the buying orders are still in excess.
Precious metals move higher
Both Gold and Silver moved notably higher on Monday and managed to stabilized at higher ground on Tuesdays early European morning. The precious metals seem to have been fuelled by a weakening USD which according to the Dollar Index moved in red territory on Monday. The weakening of the USD might have been a result of the US Manufacturing data released on Monday failing to impress traders.
Gold ascended and attempted the (R1) 1800 resistance level but failed to clearly reach it. However, the (R1) 1800 level is a very considerable level for traders not only due to the fact that it’s a round number but also because it was tested various times in April but the bulls retreated eventually. This is also a sign that it is a major challenge for the buyers while a move higher than that can send the yellow metal to the (R2) 1820 hurdle. At the top, we have placed the (R3) 1840 resistance level which was last seen in February. In the opposite direction and from a selling perspective the first level possibly found lower is the (S1) 1770 support level. Lower than that the (S2) 1755 support line that was tested in the past week is also imminent. Lower the (S3) 1730 is our lowest level for this report and can be a target in an extensive selling environment for Gold. At the moment the RSI has moved higher but remains below the 70 level showing signs of some bullish interest being present.
Other economic highlights today and early Wednesday:
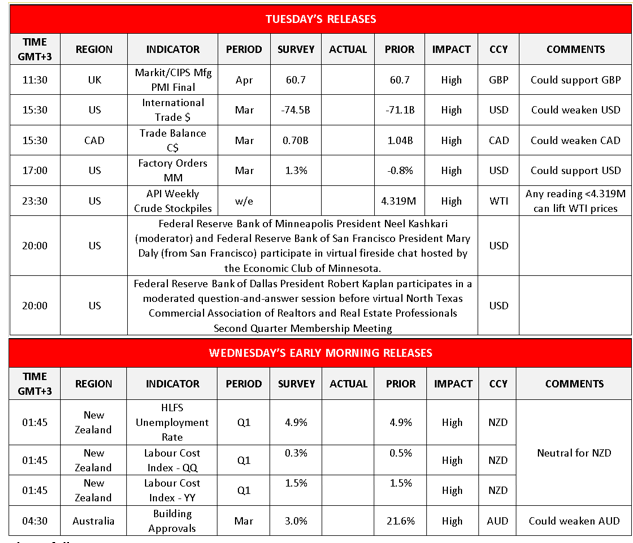
We note in the European session UK Markit Manufacturing figure for April while later in the US session we get the International trade figure for March the Canadian Trade Balance report for March and the US Factory Orders for March. Later on the release of the API weekly Crude Oil stockpiles figure is also expected. We have speeches by the Federal Reserve Bank of Minneapolis President Neel Kashkari and Federal Reserve Bank of San Francisco President Mary Daly and Federal Reserve Bank of Dallas President Robert Kaplan taking place in the US session. On Wednesday’s early morning session we get the New Zealand employment report for Q1 and the Australian Building Approvals for March.
WTI H4 Chart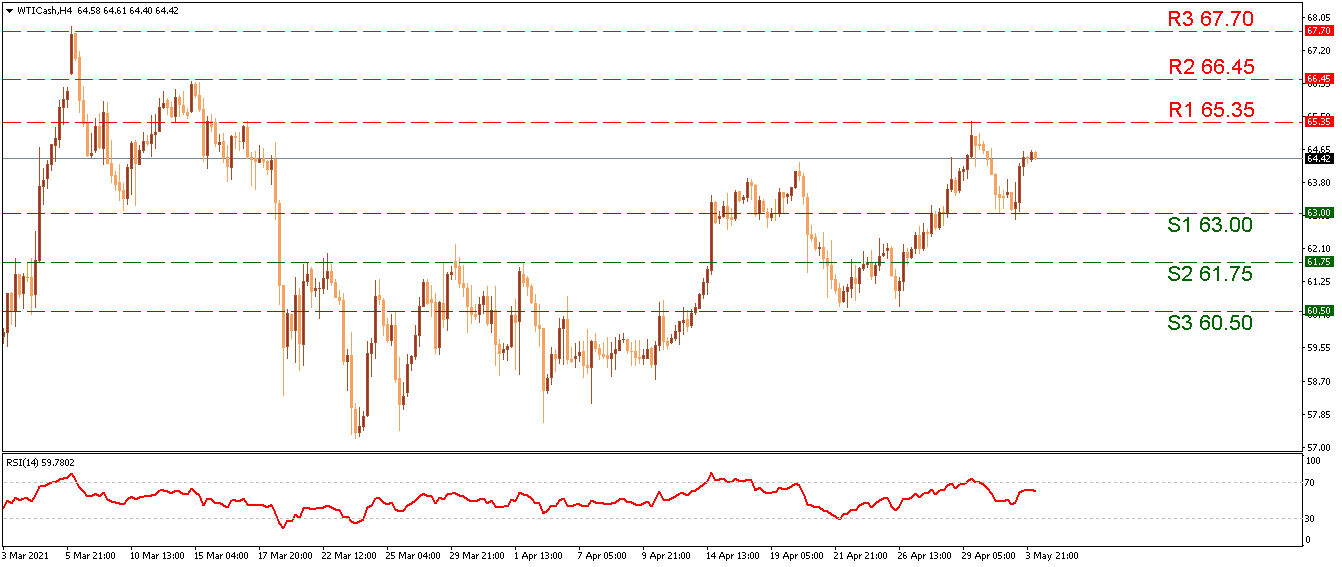
Support: 63.00 (S1), 61.75 (S2), 60.50 (S3)
Resistance: 65.35 (R1), 66.45 (R2), 67.70 (R3)
XAU/USD H4 Chart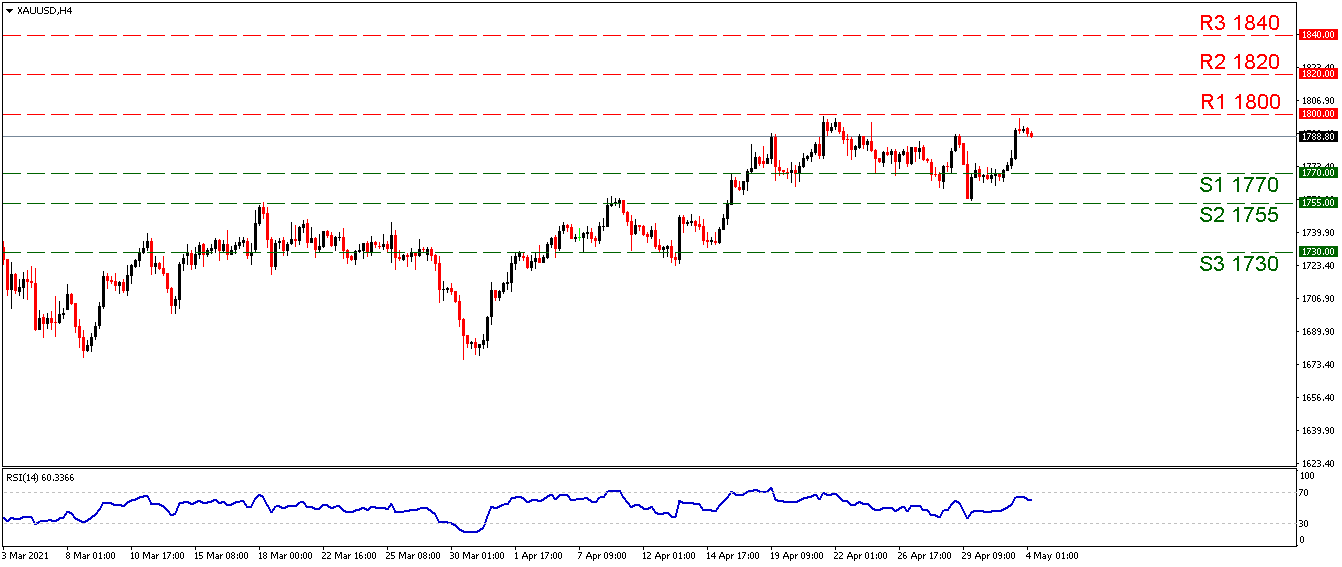
Support: 1770 (S1), 1755 (S2), 1730 (S3)
Resistance: 1800 (R1), 1820 (R2), 1840 (R3)