
Summary
United States: Housing Begins to Bump Up Against Supply Constraints
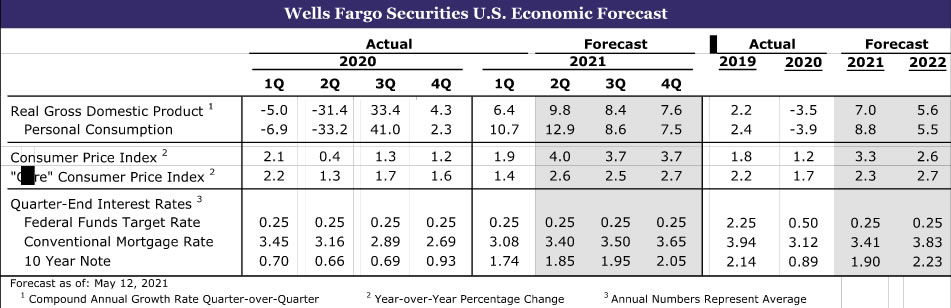
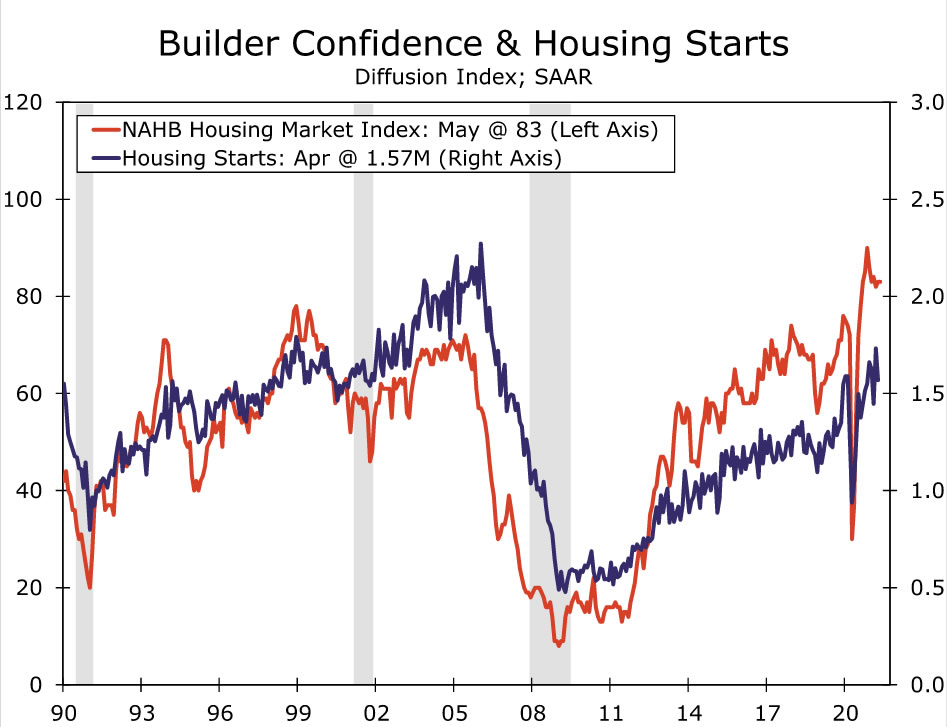
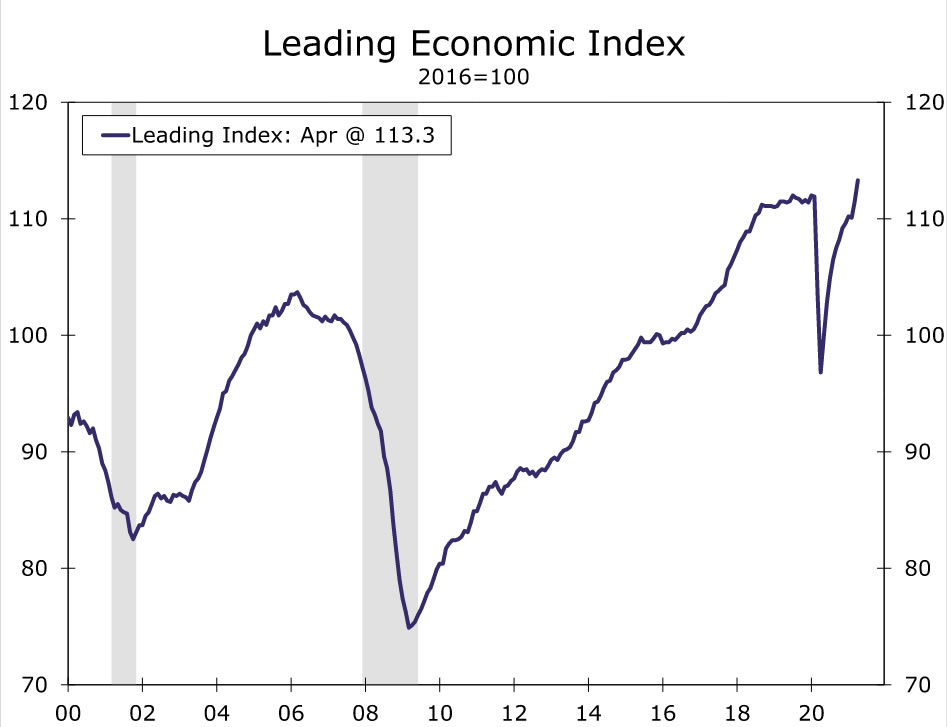
- Housing starts fell 9.5% in April, as material shortages weighed on activity. The NAHB/Wells Fargo Housing Market Index held steady at 83 in May, indicating continued strength in residential construction. Low inventories continue to hold back existing home sales, which slipped 2.7% in April. The Leading Economic Index (LEI) jumped 1.6% in April to a record high, foreshadowing a strong Q2, despite the headwinds.
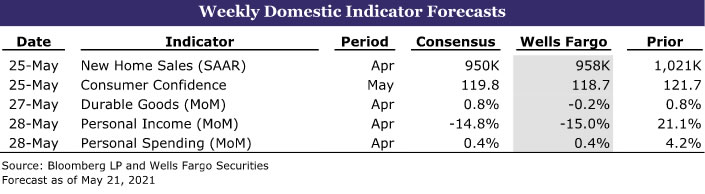
- Next week: Consumer Confidence (Tues.), Durable Goods (Thurs.), Personal Inc. & Spending (Fri.)
International: Asia Slows Down, Europe Speeds Up
- While the global economy remains on a recovery path, this week’s international news was mixed. China’s April retail sales and industrial output slowed more than forecast, and Japan’s GDP fell in Q1. In contrast, the Eurozone services PMI rose to its highest level since 2018, and the U.K. May PMIs suggested a sturdy economic expansion.
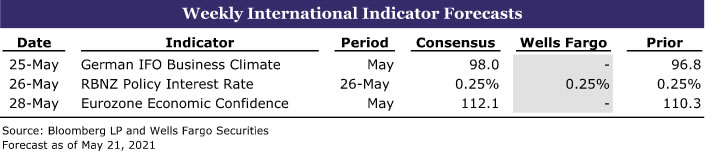
- Next week: RBNZ Policy Ann. (Wed.), German IFO Bus. Confid. (Wed.), Eurozone Eco. Confid. (Fri.)
Interest Rate Watch: Is Fed “Tapering” Imminent?
- The minutes of the April 27-28 FOMC meeting garnered more attention than usual because of one sentence. Specifically, that “a number of participants suggested that if the economy continued to make rapid progress toward the Committee’s goals, it might be appropriate at some point in upcoming meetings to begin discussing a plan for adjusting the pace of asset purchases.”
Credit Market Insights: The Case for “Foregone Consumption”
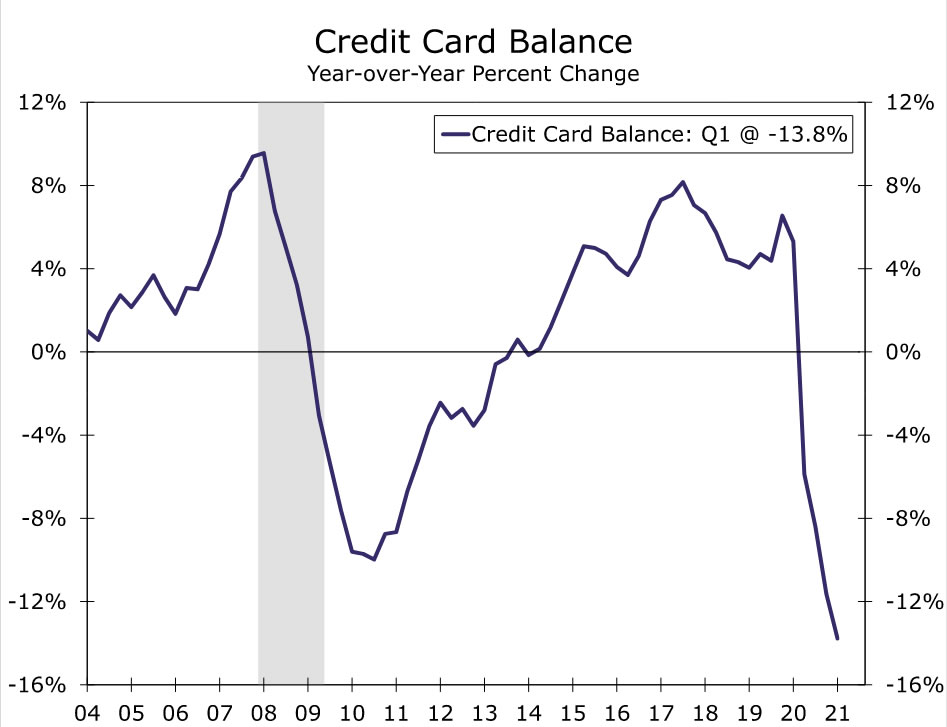
- Outstanding credit card balances remain $157 billion below their 2019 value through the first quarter. In addition to fiscal support, the inability to spend on many services or what we have denoted as forced thrift has likely freed up extra cash to use to service outstanding debt.
Topic of the Week: The Electric Slide
- Cryptocurrencies are notoriously choppy, but the volatility has been dialed up a few notches recently. Since major swings in the stock market can weigh on consumer confidence and spending, this week we examine how big of a deal recent crypto-volatility is for U.S. households.
U.S. Review
Housing Begins to Bump Up Against Supply Constraints
Over the past year, the housing market has become white-hot. Low mortgage rates and increased household space needs have propelled home sales, builder confidence and residential construction to highs not seen since the housing boom in the early 2000s. Like many other parts of the economy, however, robust housing market activity appears to be bumping up against some supply constraints.
Housing starts fell 9.5% to a still-strong 1.57-million unit pace in April. Unusually wet weather in the South and Midwest may have contributed to the decline, but the larger-than-expected drop looks to be primarily owed to shortages of building materials and qualified labor. Shortages of lumber, copper and appliances have caused the prices of those building materials to skyrocket, and builders appear to be delaying project starts as a result. Single-family starts fell 13.4% during the month, while multifamily starts edged up 0.8%. Apartment projects appear to be moving forward again alongside rebounding leasing activity, both in the suburbs and hard-hit urban markets.
Home builders remain upbeat about the current state of the housing market, despite these supply-side challenges. The NAHB/Wells Fargo Home Builders Index held steady at the elevated level of 83 in May. The current sales conditions series remained unchanged at 88, while prospective buyer traffic fell one point to 73. Both series remain near historic highs.The recent strength in the HMI indicates that new residential construction will likely continue at a fairly robust pace.
Meanwhile, the blazing-hot resale market continues to deal with its own supply issues. Existing home sales unexpectedly dropped 2.7% in April to a 5.85-million unit pace. The pace of resales would have been higher if there were more inventory on the market. Inventories improved during the month, but are still down over 20% year-to-year. The general dearth of homes for sale is putting considerable pressure on home prices. The median price of an existing home soared to over 19% year-over-year in April. Fast-rising prices and a scarce supply of homes for sale will likely continue to weigh on home buying activity. Overall mortgage applications rose 1.2% during the week ending May 14th, but purchase applications fell 4.1%, which is the sixth decline over the past eight weeks.
As we continue to note, supply constraints now appear to be holding back many parts of the economy. Federal Open Market Committee (FOMC) officials made note of these supply-side issues in the minutes for the FOMC meeting that took place on April 27-28. The major takeaway from the meeting minutes, however, was that several officials commented that “it might be appropriate at some point in upcoming meetings to begin discussing a plan for adjusting the pace of asset purchases.” For more on this, please see the Interest Rate Watch.
Fed officials’ new openness to taper-talk makes sense considering the unexpectedly strong economic data that we have received so far this year. Further evidence of the rebound in economic activity was found in April’s Leading Economic Index (LEI), which jumped 1.6% and reached a record high. The increase was broad based with eight out of ten sub-components up on the month, but the largest positive component driving the monthly gain came from initial jobless claims. Initial jobless claims, which fell to a new pandemic low of 444,000 during the week ending May 14th, have now fallen in five of the past six weeks. Overall, the recent gains in the LEI reflect the building economic momentum. And while supply-chain constraints stand to be a significant short-term headwind, we still expect 2021 to be a very robust year for the U.S. economy.
U.S. Outlook
Consumer Confidence • Tuesday
In April, the Conference Board’s Consumer Confidence Index shot up to a pandemic-era high, as COVID containment improved. While this jump in optimism did not coincide with a jump in retail spending, retail sales remain at an elevated level. Next week’s report for May will provide one of the first looks at whether higher inflation or stock market volatility are weighing on consumers’ view of the economy.
The preliminary report on consumer sentiment from the University of Michigan saw confidence fall due to higher inflation, and it is possible that similar concerns could weigh on the Conference Board’s measure. That said, fears of rising durable goods prices may have a more direct influence on Michigan’s consumer sentiment, as its headline metric includes a question on whether now is a good time to buy “big things people buy for their homes,” whereas the Conference Board just uses people’s assessment of business and employment conditions as well as their expectation for business, employment and income conditions in six months. Of course, inflation concerns can weigh on these assessments as can the S&P 500, which sold off earlier in the month before recovering most of its decline. Altogether, we look for confidence to give back some of April’s jump, but remain elevated compared to it’s COVID-era average as economic activity continues to trend toward normal.

Durable Goods • Thursday
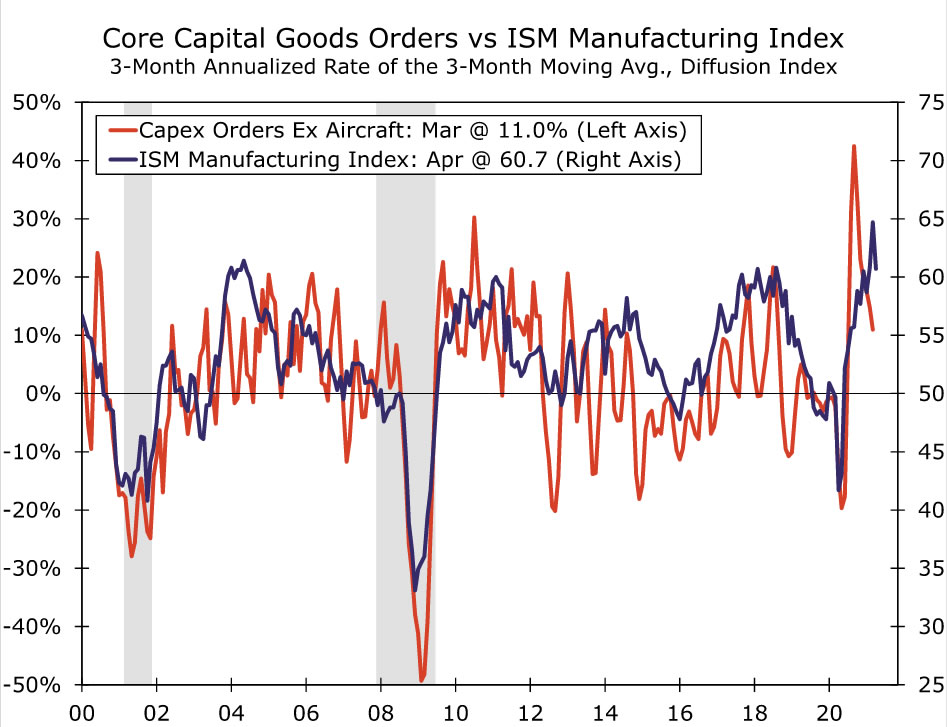
As with many parts of the economy, it seems that durable goods spending could be even stronger if not for ongoing supply constraints. In the April ISM manufacturing report, respondents across industries noted longer lead times and rising prices, with demand showing little signs of slowing. The headline index fell four points to a still strong 60.7. We expect the April durable goods orders will reflect these ongoing dynamics, though the headline may be muddied by weakness in aircraft orders. Excluding transportation, we forecast orders rose a modest 0.3%.
Beyond April, consumer demand for certain durable goods may wane as the reopened service sector starts to compete for wallet share, but there is scope for continued growth, as businesses look to invest and producers stock depleted inventories. While rising prices and short supplies may cap some of this spending, we expect equipment spending to contribute meaningfully to GDP growth in 2021.
Personal Income & Spending • Friday
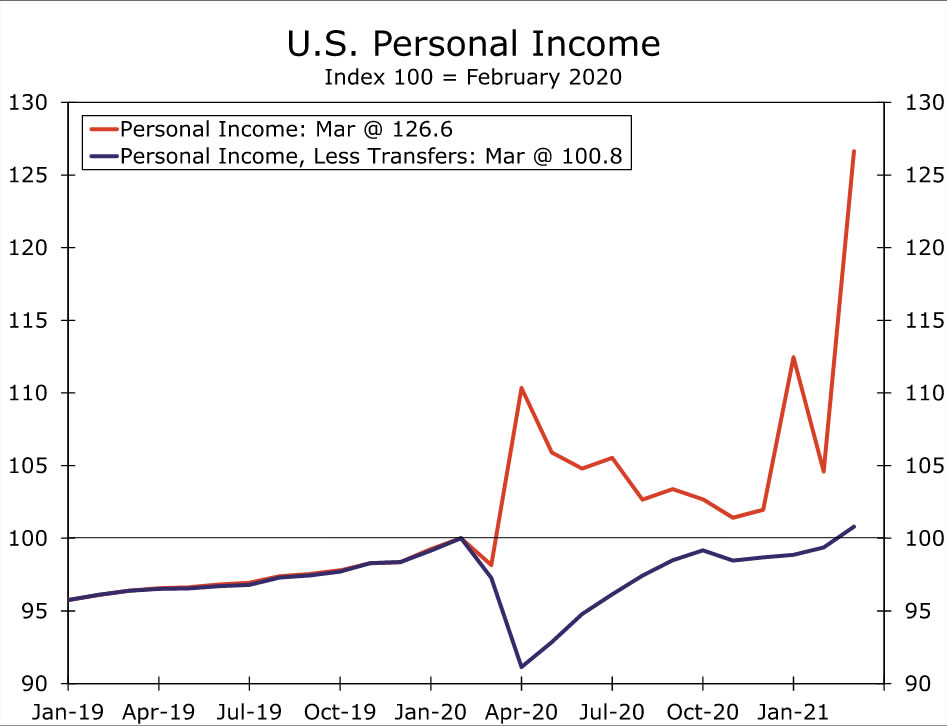
Personal income soared in March, as most households received their second and considerably larger stimulus check of the first quarter. In the April report, we expect to see some pay back for last month’s stimulus-charged gains, and forecast personal income declined 15% month-over-month. But, excluding government transfer payments, personal income likely rose around 1.3% during the month.
March checks also boosted spending, which saw its largest month-over-month gain since coming out of lockdowns in June of last year. While we may not see another big jump, we expect that personal spending eked out a 0.4% gain in April, as consumers continued to take part in the reopening of the service sector. The flat reading for April retail sales suggests goods spending was weak, but services consumption (restaurants, transportation services, recreation services) should have boosted headline spending.
Overall, looking through the recent stimulus-related volatility, personal income excluding transfers is already roughly back in line with its pre-pandemic levels (blue line in chart). While these aggregate numbers obscure difficulties that some in high-contact service sectors have faced over the past year, stable income growth in other sectors along with substantial support from the federal government has left households in a good position to spend as the economy continues to reopen.
Next week’s report will also bring April’s reading on the Fed’s preferred measure of inflation, the core PCE deflator. Friday’s report is likely to show a jump in inflation for April, similar to the Consumer Price Index. We expect the headline and core deflators rose 3.6% and 3.0% year-over-year, respectively, boosted by low base effects from last year’s price drop. It is not all base effects, however, we expect the month-over-month numbers will reflect the increasing price pressures seen across the economy. Specifically, we forecast a 0.7% jump in the headline and core measures.
International Review
China’s Economic Growth Softens in April
It has been a mixed start to the year for the Chinese economy, with localized outbreaks of new COVID cases weighing on economic activity at times. While the Chinese data have yet to provide a completely “clean” read on the economy, as we move into Q2-2021, there are now comparisons with the more “normal” level of activity in Q2-2020 rather than the depressed levels of output seen in Q1-2020. In that context, activity data for April, and indeed the second quarter of 2021 as a whole, will be closely scrutinized since it might begin to offer some insights into the underlying trends of the economy.
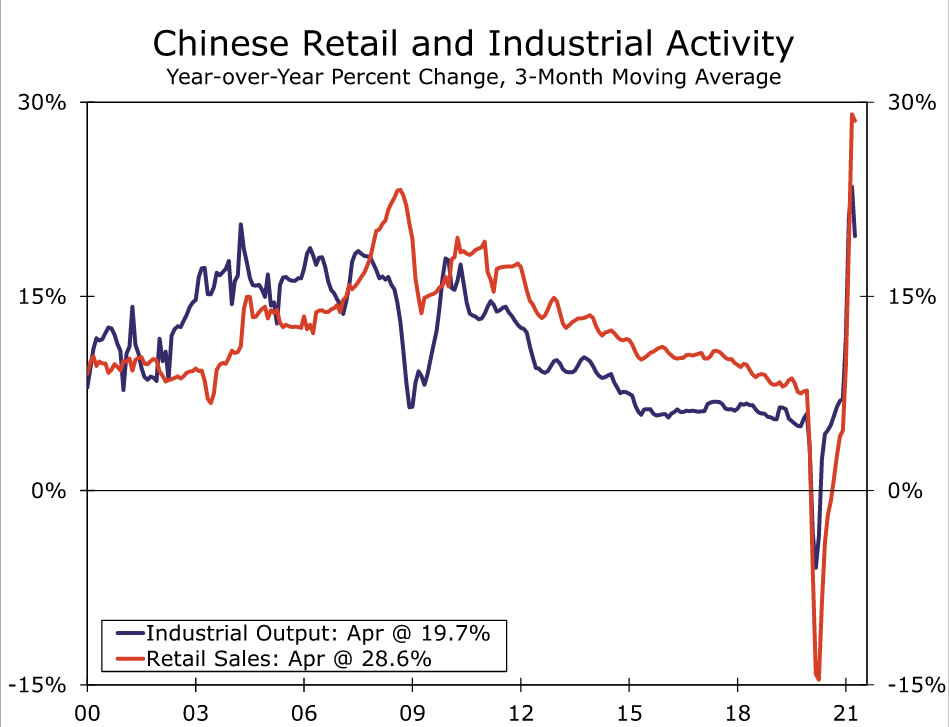
In that context, the April activity from China were mildly underwhelming, particularly as it relates to the services sector. To be sure, activity remains quite sturdy with April retail sales rising 17.7% year-over-year. Nonetheless, that was still a sharper slowdown than expected, as the consensus forecast had been for a 25.0% gain. April services production also slowed noticeably to 18.2% year-over-year. Growth in April industrial output slowed to 9.8%, but was much closer to the consensus forecast which had been for a 10.0% increase. Given the signals from China’s economy this year we have already lowered our full-year 2021 GDP growth forecast to 9.0%, though arguably there remains some modest downside risk to that outlook.
Japan’s GDP Contracts in Q1-2021 as COVID Concerns Continue
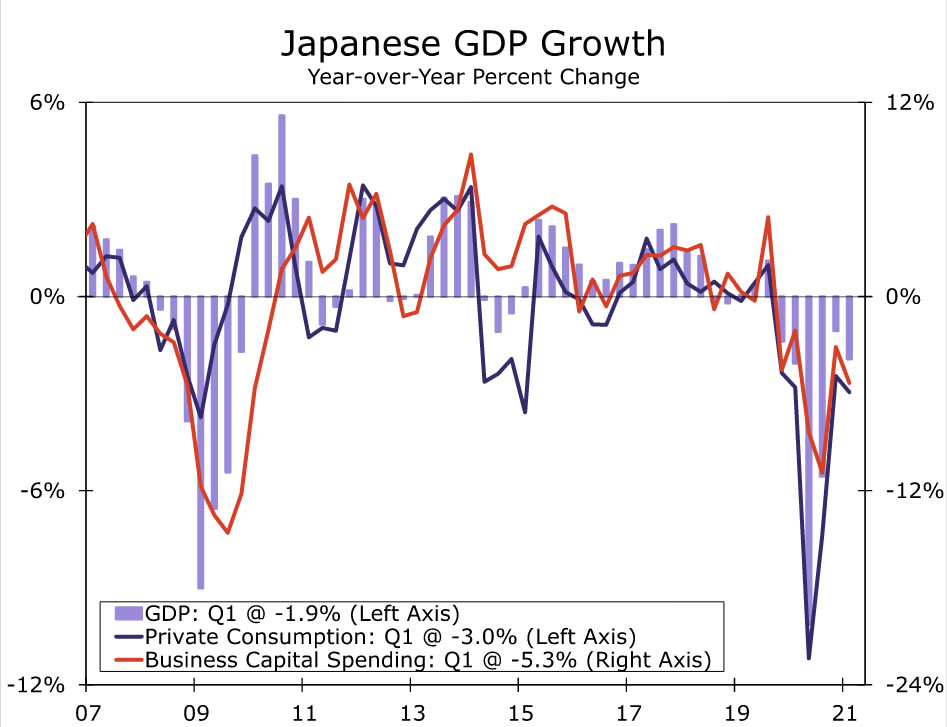
Japan is the latest of the major developed economies (following the Eurozone and the United Kingdom) to report a contraction in GDP in Q1-2021. Reflecting a renewed wave of COVID cases and associated restrictions that weighed on economic activity, Japan’s Q1 GDP shrank at a 5.1% quarter-over-quarter annualized pace, a larger fall than either we or the consensus had expected. The weakness in economic activity was fairly widespread. Household consumption shrank at a 5.6% quarterly annualized rate, while business capital spending shrank at a 5.5% pace. Moreover, while the public sector had been a source of relative resilience in recent quarters, that was not the case in Q1, as both public demand and private demand reported declines.
The outlook for second quarter activity is also challenging given a new state of emergency declared for Tokyo and surrounding regions in late April, and now extended through until the end of May. We have penciled in a 3.2% quarter-over-quarter annualized increase in GDP for Q2-2021, though there is clear downside risk to that outlook given the latest COVID-related developments.
Eurozone Economy Returning to a Recovery Course
The Eurozone May Purchasing Managers Indices pointed to an economy that is returning to a recovery path. The May manufacturing PMI was broadly steady at 62.8, indicating an ongoing expansion in the industrial sector. The more notable element of this week’s release was the May services PMI which rose much more than expected to 55.1, the highest level for that index since 2018, with the new business sub-component also rising sharply. In terms of the region’s major economies, the French May services PMI jumped to 56.6, while the German services PMI rose to 52.8. Meanwhile, across the English Channel, the May PMIs for the United Kingdom remained elevated. In fact, the manufacturing PMI jumped further to 66.1, while the services PMI rose to 61.8.
International Outlook
RBNZ Monetary Policy Announcement • Wednesday
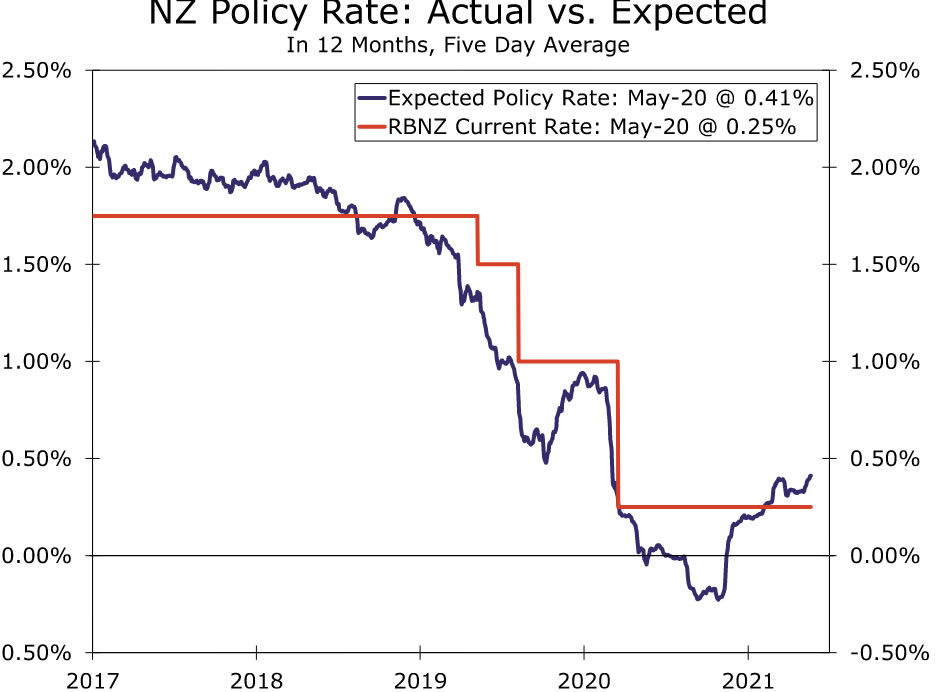
The Reserve Bank of New Zealand (RBNZ) announces its latest monetary policy decision next week. We do not expect any changes at next week’s meeting, but the accompanying announcement and Monetary Policy Statement could be less dovish in tone. With respect to policy, we expect the official Cash Rate to remain at 0.25% and the target for the Large-Scale Asset Purchase program to remain unchanged at NZ$100 billion. The purchase program is scheduled to run until around June 2022, and cumulative purchases so far currently total a bit more than NZ$50 billion.
Despite the steady policy stance, it is possible the central bank’s rhetoric could be somewhat less dovish in tone. The RBNZ will provide updated economic projections, which we expect to show a stronger GDP outlook and also potentially a higher inflation forecast. In terms of policy guidance, the RBNZ has repeatedly stated that it is prepared to lower its policy interest rate if required. If the RBNZ removes that reference to lower interest rates—which is a possibility—that would represent at least a modest change in guidance.
Eurozone Economic Confidence • Friday
Next week sees the release of more confidence surveys from the Eurozone. We will look for confirming evidence and additional context about the region’s economic recovery, following this week’s Purchasing Managers Indices.
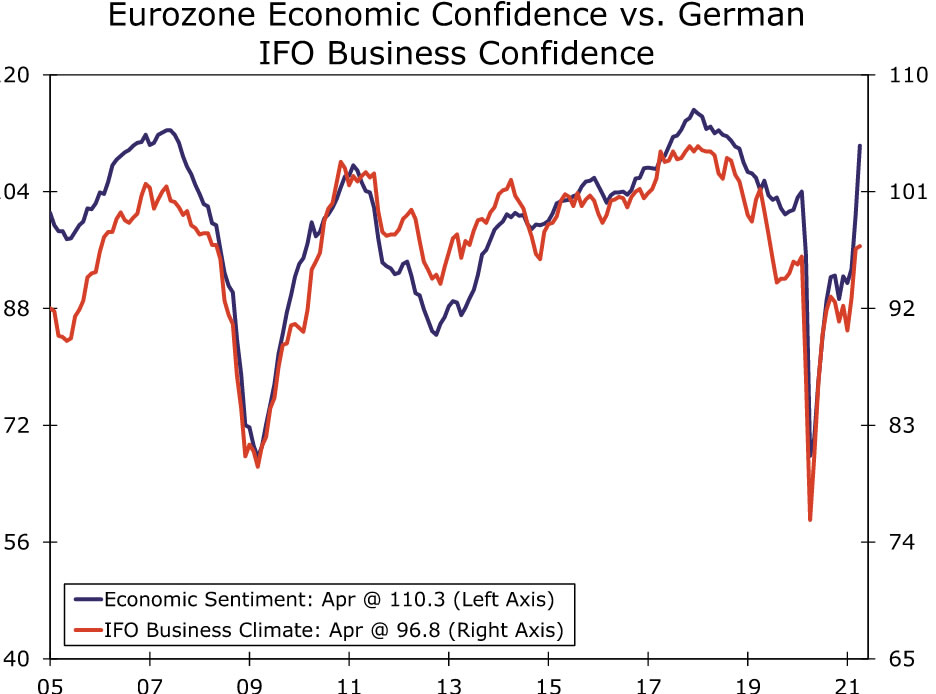
On Friday, May Eurozone Economic Confidence is published. The headline index is expected to gain further to 112.1, from 110.3 in April, which would represent the fourth monthly increase in a row. Among the sub-components, industrial confidence is forecast to rise to 11.0, while services confidence should improve to 6.0. Earlier in the week on Tuesday, May Germany’s IFO Business Climate—a key confidence survey for the Eurozone’s largest economy—is also released. The headline index is expected to rise to 98.0, with gains anticipated for both the expectations and current assessment components.
Interest Rate Watch
Is Fed “Tapering” Imminent?
The minutes of the April 27-28 meeting of the Federal Open Market Committee (FOMC), which were released this week, garnered more attention than usual because of one sentence. Specifically, the minutes noted that “a number of participants suggested that if the economy continued to make rapid progress toward the Committee’s goals, it might be appropriate at some point in upcoming meetings to begin discussing a plan for adjusting the pace of asset purchases.” That is, “a number” of FOMC members think it may be appropriate, assuming that the strong pace of the recovery that has been experienced to date remains intact, to soon think about how to dial back the Fed’s monthly purchases of $80 billion worth of Treasury securities and $40 billion worth of mortgage-backed securities (MBS).
Is the Fed getting ready to “taper”? Not yet, in our view. The minutes also noted that Committee members judged that “the ongoing public health crisis continued to weigh on the economy, and risks to the economic outlook remained.” Inflation has risen in recent months, but the unemployment rate remains elevated at 6.1%. The FOMC has said that continuing the current pace of asset purchases will be appropriate until “substantial further progress had been made toward the Committee’s maximum-employment and price-stability goals.” With payrolls remaining more than 5% below their pre-pandemic level, many FOMC members seem to believe that further progress needs to be made before dialing back the pace of asset purchases. In that regard, all 11 voting members of the Committee supported the decision on April 28 to maintain the current pace of asset purchases.
In our view, the Committee will likely discuss when to start tapering at either the June 15-16 or the July 27-28 FOMC meetings. And those discussions, if they indeed occur, will be mentioned in the minutes of those meetings. But we believe that “substantial further progress” will not be achieved until late summer/early fall. At that time, we expect that Fed officials, most likely beginning with Chairman Powell, will start to discuss “tapering” in speeches or Congressional testimony. As we discussed in this space in our March 26 Weekly Commentary, we look for the tapering process to formally commence early next year. The upshot is that long-term interest rates will trend gradually higher as market participants begin to anticipate the gradual winding down of the Fed’s asset purchases. In that regard, we look for the yield on the benchmark 10-year Treasury security, which currently sits a bit above 1.60%, to end the year around 2.00%.
Credit Market Insights
The Case for “Foregone Consumption”
Outstanding credit card balances remained $157 billion below their 2019 value through the first quarter of this year. After declining $108 billion last year amid a pullback in consumption, balances dropped another $49 billion in the first quarter despite a sizable pick-up in consumption.
While many factors could have contributed to consumers’ ability to service credit card debt over the past year, a recent report from the New York Fed, which looked into demand and supply factors around consumer credit, points to fiscal intervention, such as stimulus checks and unemployment insurance benefits, as a likely reason.
We have previously discussed how consumers may have used excess savings to pay down debt, but detailed data from the New York Fed showed wealthier and older cohorts led the charge in the decline of credit card balances over the past year. Higher income zip codes reduced balances by 19% during the pandemic compared to a 15% reduction for lower income ones. While younger borrowers’ balances are nearing pre-pandemic levels, those for the 60+ age range are still down a little shy of 20%.
In addition to fiscal support, the inability to spend on many services over the past year or “forced thrift” has likely freed up extra cash to service outstanding debt. This is likely particularly true for wealthier households, as fiscal support was not a driver of savings for the high-income cohort since their jobs were largely shielded from layoffs, and they did not qualify for stimulus checks. Further, additional research from the New York Fed suggests spending patterns of wealthier households in particular were dramatically changed by the pandemic.
Pre-pandemic, high-income households spent more on “pandemic-constrained” goods and services, which the New York Fed defines as expenditures that had to be cutback because of social distancing measures. Therefore, typical consumption bundles of higher income groups were more constrained during the pandemic than lower-income cohorts. The decline in spending likely also prevented them from adding to outstanding credit card debt balances, and this forced thrift or foregone consumption bodes well for future spending.
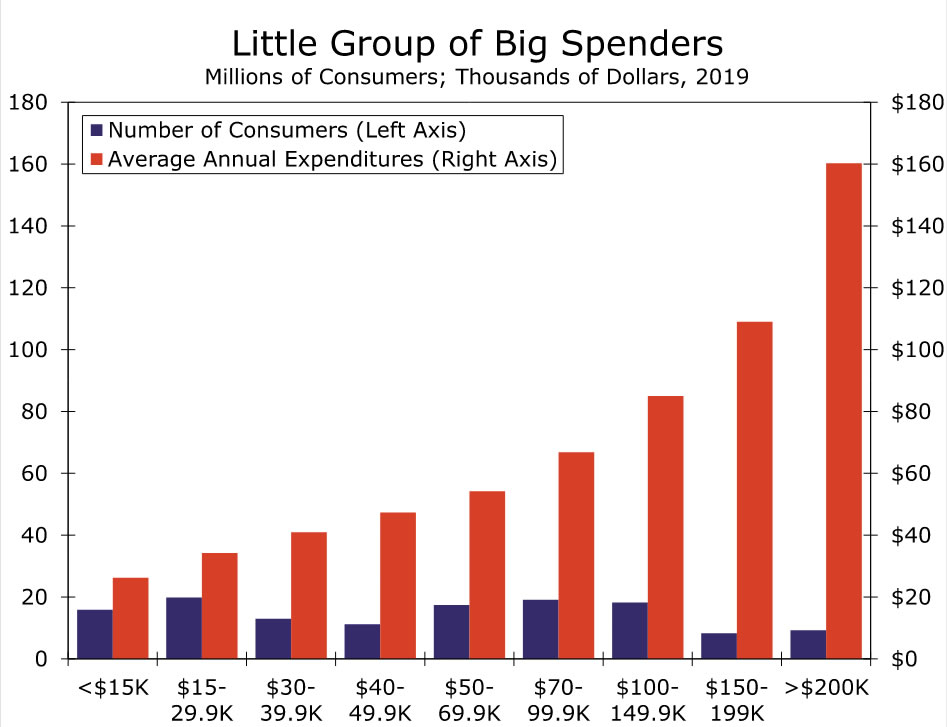
The top 10% of household earners make up almost half of total personal outlays in the U.S. economy. So as the economy continues to reopen and consumers are able to once again consume many services, this “little group of big spenders” will be vital to unleashing pent-up demand and propelling the consumer spending rebound.
Topic of the Week
The Electric Slide
Cryptocurrencies (cryptos) are notoriously choppy but the volatility has been dialed up a few notches recently. Bitcoin claims the title for the biggest cryptocurrency in terms of market cap (for now, at least), and it shed more than a third of its value in the past two weeks. This came after doubling in value just since the start of this year. From a high of $63,410 in mid-April, Bitcoin currently sits just below $40,000 as of this writing (see chart).
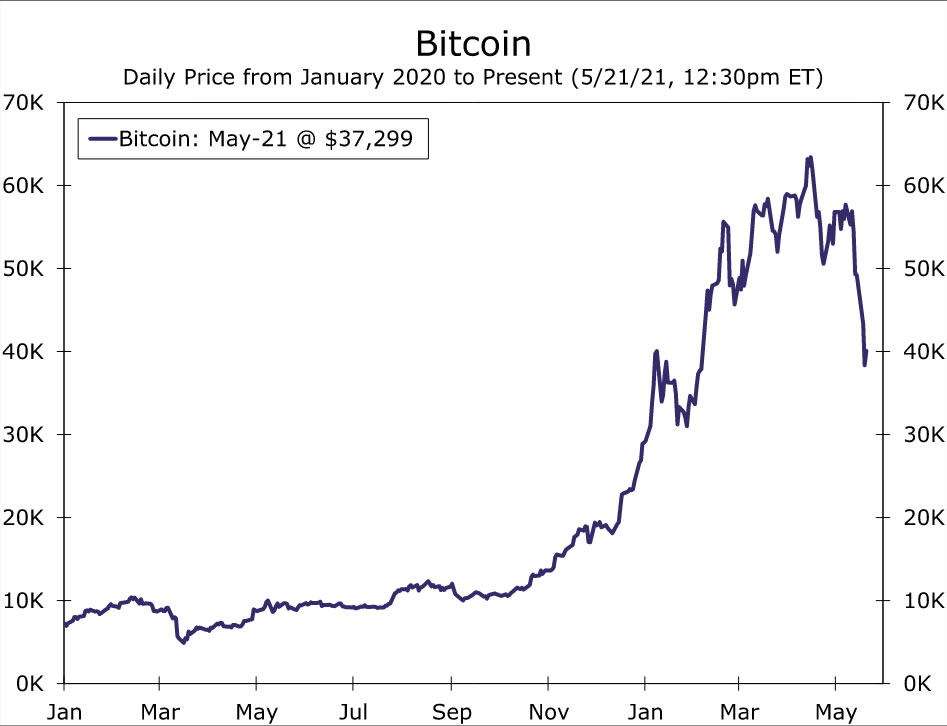
The recent slide began on May 11, but a great deal of the volatility occurred this past Wednesday when Bitcoin plunged about 30%, erasing $12,000 in price and hundreds of billions in value, in the matter of hours. Bitcoin and other cryptos then sharply retraced losses amid an afternoon surge of 25%, propelling Bitcoins price back up close to $40,000. Other cryptos faced similar volatility over the course of the week.
The asset is known for its turbulence, but such large price swings could still spook investors. Major swings in the stock market can weigh on consumer confidence and spending, so how big of a deal is the recent crypto-volatility for U.S. households?
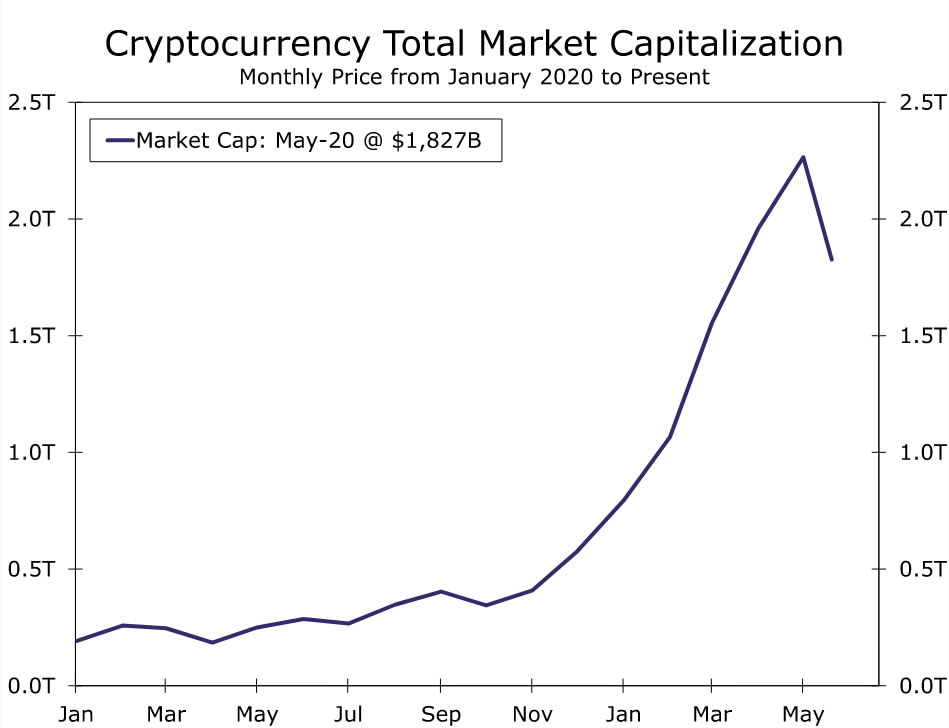
To gauge household exposure, start with the fact that total market cap stands at $1.8 trillion today (see chart) after soaring to as high as $2.6 trillion just last week. This suggests at its high, cryptos were about 2.5% of the size of total financial assets held by the U.S. household & nonprofit sector. Of course, since cryptocurrencies are held worldwide, the percentage held by U.S. households is actually even smaller. Recent volatility is therefore likely not a significant concern for the financial stability of the U.S. household sector.
That said, it is still an asset worth watching. In the latest financial stability report from the Federal Reserve, cryptocurrencies and other stable-coins were among the 14 potential shocks over the next 12 to 18 months most cited by market contacts.
Although decentralized control is a feature of great appeal among enthusiasts of Bitcoin and other crypto-plays, the Fed this week addressed its own research into cryptos. The press release explicitly stated that the Fed is exploring the potential benefits and risks of a Central Bank Digital Currency (CBDC) and it expects to release a paper discussing their findings and solicit feedback from the public later this year. Perhaps Gov-coins or CBDC will eventually become a tool for central banks to conduct monetary policy. Until then, the surest prediction about bitcoin and other crypto-currencies, is that whether its value rises or falls on any given day is about as predictable as a flip of a coin.


