
Last week we released our updated forecasts for the Reserve Bank’s next tightening cycle.
We expect that the Bank will begin its tightening cycle in the first quarter of 2023 with a 0.15% lift in the cash rate.
That is expected to be followed by two more increases in 2023 of 0.25% each lifting the cash rate by year’s end to 0.75%.
We do not publish forecasts beyond 2023 but on this occasion feel it is necessary to provide some guidance for our long term views on the peak of the tightening cycle and the timing of that peak.
In providing these guidelines we are relying on three key principles.
- We do not envisage extreme inflation conditions during the cycle that would cause the RBA to need to overshoot policy. Instead we expect that the inflation will remain within the 2-3% target band and the labour market will hold at around full employment.
- Whereas easing cycles can last for very long periods (November 2011 – November 2020 was the last cycle) tightening cycles tend to be much more concentrated. Recent tightening cycles have been: October 2009– November 2010; May 2006–March 2008; November 1999–August 2000.
- The upside limit to Australia’s tightening cycle is likely to be determined by the household sector’s sensitivity to rising rates given Australia’s high levels of household debt.
Using those broad guidelines we are pencilling in two further 0.25% rate increases in 2024 lifting the terminal cash rate to 1.25% by November 2024.
That profile would satisfy each of the key principles.
The pace of the rate increases – total of 0.65% in 2023 and 0.50% in 2024 would be consistent with a measured move to normalise the rate structure at a time when the RBA is achieving its key objectives without jeopardising those objectives by over shooting policy.
The cycle would span a little short of two years –broadly comparable to the length of previous tightening cycles.
Based on a number of measures we are using to address any stress levels for household borrowers we believe that a cash rate of 1.25% represents the “limit” above which interest rates would be contractionary through their impact on household finances.
Because our forecasts of inflation and wages do not point to any overshoot during that period we do not believe it will be necessary or desirable to move policy into the contractionary zone.
How have we assessed that point of Mortgage Stress?
A reasonable starting point or upper limit to any rate cycle should be the stress guideline used by mortgage lenders.
Industry practice is currently to stress loans at 2.5% – in effect if the mortgage rate was to increase by more than 2.5% lenders would be uncomfortable with potential risks of mortgage stress for some borrowers.
Figure 1 shows an estimate of the proportion of disposable income owner occupiers need to service their debt under various assumptions around the peak in the tightening cycle.
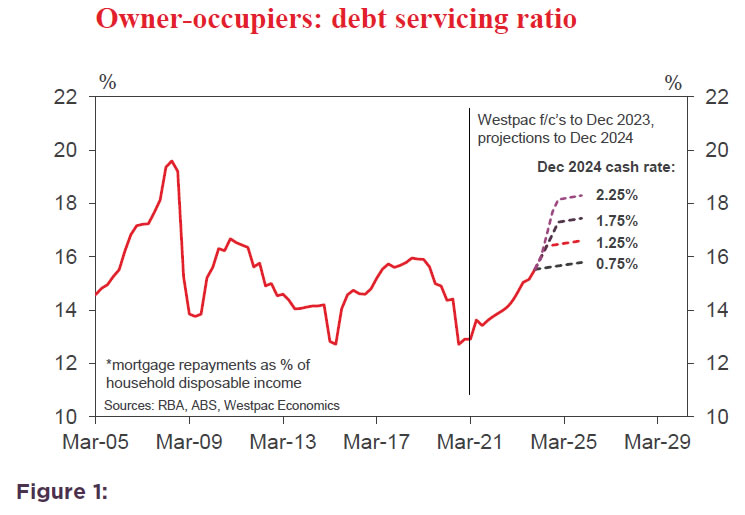
Assumptions required to generate these ratios include the average interest rate across loans (allowing for a mix of standard, interest only and fixed rate loans); the outlook for household incomes and owner occupier debt levels out to the end of 2024 (including implications from our forecasts for house prices).
Prepayment buffers are important given their role of insulating some borrowers to rate increases.
In its latest Financial Stability Review (April 2021) the RBA noted that one quarter of loans have a prepayment buffer of more than 2 years although the share of loans with prepayment buffers of only one month remains close to 40%- a substantial share of outstanding loans although around 65% of those loans are held by investors.
The stock of household debt by 2024 will include a much larger share of borrowers with limited prepayment buffers under our reasonable assumption that there will be no more rate cuts in this cycle.
New borrowers since the beginning of 2021 will not benefit from rate cuts .
We estimate that the stock of owner occupier loans represented by new borrowers since the beginning of 2021 could be around 30%.
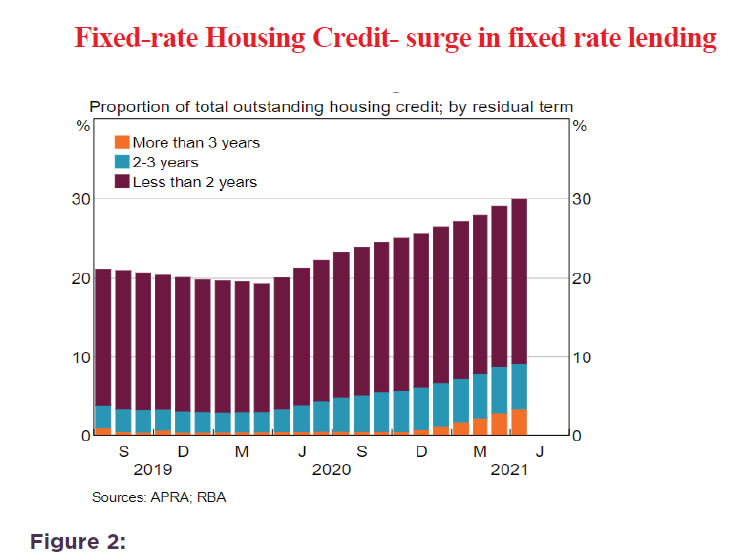
Figure 2, (Christopher Kent, RBA,, Graph 7, 9 June 2021 ) demonstrates that there has been a sharp increase in the volume of fixed rate loans with this share increasing from 20% to 30% since mid-2020.
However, only around 10% of loans have been fixed for longer than three years.
Effectively over our forecast horizon 90% of the current fixed rate loans will have rolled off exposing borrowers to the higher rates, although some new fixed rate loans taken out in 2022 will not mature until after 2024.
Figure 1 indicates that an increase in the cash rate to 1.25% in 2024 would see the servicing ratio lift to around the peaks we saw in 2010 and 2018.
The lift in the ratio in 2010 reflected the 175 basis point increase in the cash rate between October 2009 and November 2010 whereas the high servicing ratio in 2018 was being driven by rising debt levels as house prices boomed.
As foreshadowed above, an increase in the cash rate to 2.25% would see a damaging lift in servicing ratios nearing those pre GFC peaks.
However, it would be misleading to claim specific accuracy with this methodology.
Respectable cases could be made for peaks of 1% and 1.5% but on this metric it would only be appropriate for RBA to go beyond 1.5% if there was a significant risk of inflation overshooting or labour markets becoming intolerably tight.
Implications for this Scenario with Respect to the Federal Reserve Policy
Readers will be aware that this estimate of the cash rate trajectory implies an equilibrium real yield of around –0.75%.
Such a level is below the short-term neutral rate we expect the Federal Open Market Committee (FOMC) assesses for the US.
Admittedly the debate on r star (or real neutral) has shifted from comfortably positive to potentially below zero.
Recently, 2016 – 2019 demonstrated that the RBA cash rate does not need to follow in lock step with the Federal Funds Rate.
Over most of that period the cash rate held steady at 1.5% (a potential equilibrium) while the Federal Funds Rate lifted from 0.375% to 2.375% by December 2018.
Arguably, the performance of the Australian economy over that period indicates that, in hindsight, the 1.5% policy rate was too high.
For the US, at the time, the 2.375% was hailed as around neutral (positive real) although it turned out to be an overshoot as the FED was subsequently forced to ease the rate back to 1.625% by October 2019 – arguably a better estimate of neutral for the US.
Westpac is already forecasting that the FOMC will begin its tightening cycle in December 2022 and raise the Federal Funds Rate to 0.875% by June 2023.
It seems reasonable to expect a resting neutral Federal Funds Rate will be higher than the RBA’s 1.25% given the much reduced sensitivity of the US household sector to the Federal Funds Rate- lower debt to income ratios; dominant fixed rate borrowing.
A Federal Funds Rate of around 1.625%, (back to the pre covid level) in 2024 is consistent with our views on the US economy and the likely “resting” neutral rate.
Conclusion
We are comfortable with the methodology used to project the profile of the tightening cycle way out through 2024.
But, of course, there are many variables that affect the results – credit growth; employment and wages growth; house prices; inflation dynamics; global risks.
However, the general principles of the analysis – importance of household debt; RBA neutral likely to be lower than FED; relatively low resting neutral rate ae important foundations to our thinking.


