
U.S. Highlights
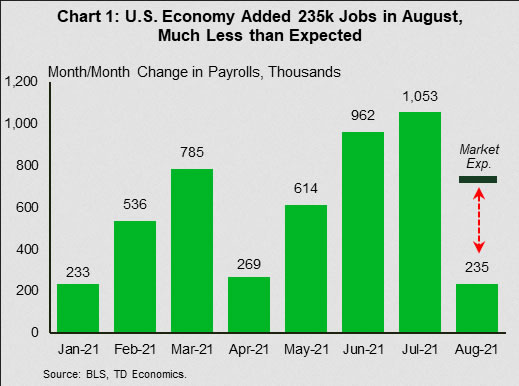
- U.S. job growth slowed to 253k in August, well below market expectations for a 720k print. But the report also had plenty of bright spots. The jobless rate fell to 5.2% from 5.4%, while wage growth accelerated to 4.3% (y/y) from 4.1%.
- Progress in the recovery of jobs in leisure and hospitality – an industry that has been a primary driver of gains in recent months but that is sensitive to changing public health conditions with respect to the pandemic – stalled in August.
- Several other indicators echoed a deceleration in economic activity alongside an increase in COVID-19 infections as the summer was drawing to a close. These include the ISM services index, auto sales and pending home sales.
Canadian Highlights
- Second quarter GDP results dominated headlines this week. The economy contracted unexpectedly, its first decline since the pandemic struck in the second quarter last year.
- The weakness was concentrated in residential investment and exports. Meanwhile, consumption was flat in the quarter as the third wave weighed on services spending.
- Statistics Canada indicated in its advance estimate that output will decline again in July. But early estimates usually underpredict actual GDP. In addition, the statistical agency may not be fully accounting for strong gains in services spending.
U.S. – Blame it on Delta
The week leading up to Labor Day Weekend was rich in economic data. Taken as a whole, the reports indicate that economic growth lost some steam in August, but that activity likely remained at fairly healthy levels. The most-awaited report of the week, the payrolls report, is a case in point. Job growth in August not only decelerated from a very strong July, but the 235k jobs print came in well below market expectations (Chart 1). Of note, progress in the leisure and hospitality sector – a primary driver of gains in recent months – stalled in August. Gains were led by professional and business services (+74k) and transportation and warehousing (+53k). The unemployment rate also made some progress, falling to 5.2% from 5.4% in the month prior. Meanwhile, average hourly earnings accelerated to 4.3% (year-over-year) from 4.1%. In short, while the employment report was certainly not as strong as expected, it still had plenty of bright spots.
The ISM Services Index carried through a similar narrative. The index came off a record high in the month prior, falling 2.4 points in August. Still, at a level of 61.7, it remains well in expansionary territory. The ISM manufacturing counterpart, which encompasses a smaller share of the economy, did better, rising 0.4 points to 59.9. This mild August uptick, however, does little to reverse a decelerating trend that has been in the works since March. What’s more, the underlying indicators in the manufacturing report still point to supply-side issues that continue to hamper the industry’s ability to meet demand.
Supply-related issues also featured in the vehicle sales report. Auto sales fell 10.7% to 13.1 million units (seasonally adjusted annual rate) in August, marking the fourth consecutive month of decline. Low inventory levels as a result of microchip shortages and other pandemic-related disruptions appear to be the main culprit behind the trend.
Tilting to the housing market, pending home sales pulled back for the second consecutive month in July, falling 1.8%. Pending sales lead actual sales by 1-2 months. As such, the pullback suggests that the upcoming August existing home sales report may also show some softness.
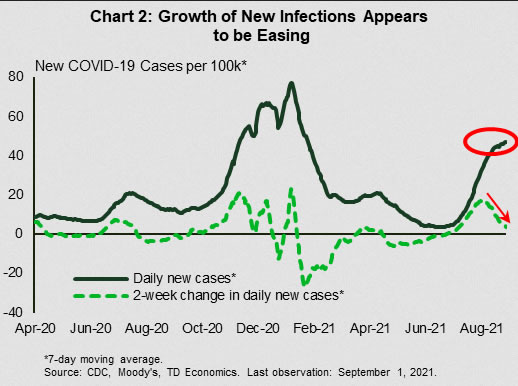
The deceleration in economic activity over the last month occurred alongside an increase in COVID-19 infections. The latest Delta-driven infection wave is likely a key factor behind the stalled progress in the recovery of leisure and hospitality payrolls, and behind some softening in consumer confidence (the latter fell to a six-month low in August). This headwind may continue in the near-term. Meanwhile, the sudden end to the eviction moratorium last week and the upcoming cutoff of pandemic unemployment benefits on Labor Day will add to difficulties for vulnerable households, likely taking a toll on spending. On a positive note, early indications that the pace of infections may be easing are a good sign, even as the inherently capricious nature of the virus offers little comfort (Chart 2).
With near-term risks tilted to the downside, we expect the Fed to wait for more confirmation of economic resilience before tapering later this year.
Canada – Second Quarter GDP Shocker
Second quarter GDP dominated headlines this week. The economy, which most had predicted to continue to recover in the second quarter — albeit at a slower pace — contracted unexpectedly. On a quarter-over-quarter annualized basis, GDP declined by 1.1%, while the consensus call was for a 2.5% expansion. This was the economy’s first decline since the pandemic struck in the second quarter last year. So, what happened? How did analysts get the call so wrong?
That’s because economy watchers did not foresee Statistics Canada making significant downward revisions to monthly GDP data, which form the basis of quarterly GDP calls. The statistical agency weakened month-over-month growth in April from -0.5% to -0.9%, while the May figure was lowered from -0.3% to -0.5%. These changes meant Canada’s economic performance in the second quarter was considerably weaker than what was previously thought.
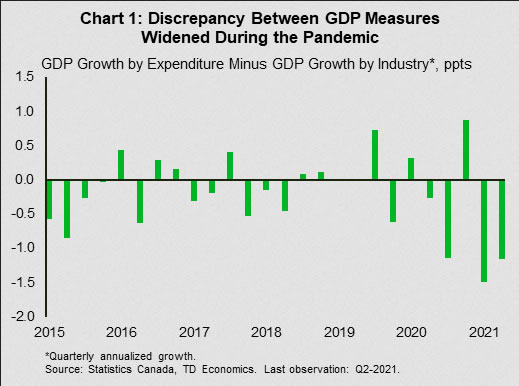
It’s important to note that monthly GDP data is calculated on an industry basis, while the quarterly headline series is constructed using expenditure components. Historically, growth in these two series has been closely correlated, but recently a gap has opened up (Chart 1). This likely reflects difficulties Statistics Canada has had in collecting data during the pandemic. Still, both GDP by expenditure and GDP by industry point to a subpar showing in the second quarter.
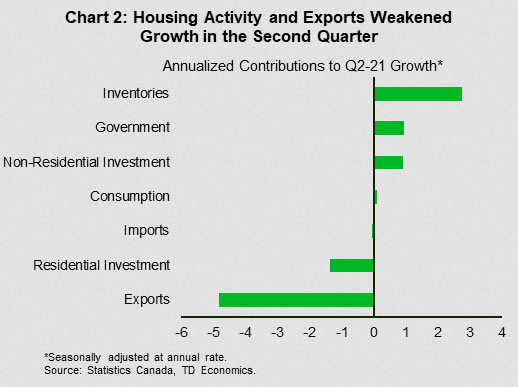
According to the expenditure accounts, residential investment and exports were the primary drivers of the weakness (Chart 2). The former doesn’t come as a surprise since housing market activity cooled recently with housing sales and starts in June around 20% below their March peaks. On the exports end, supply disruptions, particularly microchip shortages, badly hurt auto production, leading to a -47% (annualized) decline in motor vehicles and parts exports. Household consumption was also disappointing in the second quarter. Spending barely moved from its first quarter level as pandemic-related restrictions held back services consumption.
Despite the overall weakness, the second quarter ended on good note. Reopening of provincial economies led to a 0.7% m/m rebound in economic output in June, with high-touch services sectors seeing substantial gains. Surprisingly, the economic momentum appears to have been short-lived as Statistics Canada’s flash estimate showed a 0.4% contraction in July GDP.
But there are good reasons to believe the statistical agency may be underestimating economic activity that month. First, the advance estimate is only produced with partial data in which services consumption information may be inadequate. TD credit and debit card spending data suggest a strong pick up in high-touch services expenditure throughout July which may not have been incorporated by Statistics Canada. Two, the flash estimate has typically underpredicted the actual release since it was first published in March of last year. Out of 16 releases, the early figure underpredicted official data 10 times. We could see the same happen when July data are formally published on October 1st.


