
Gold continues to be up for the second consecutive week and today has surged notably in the European morning surpassing the $2000 per ounce barrier. Even though Gold traders have a packed economic calendar with significant releases in the upcoming days, the market is currently concerned about the impact of geopolitical happenings on the global economy. This report will shed light on the most dominant factors driving the Gold market and close with a technical analysis identifying important price levels for traders to keep in mind.
From our point of view Gold’s most visible upward movement came on the 4th of March during the US employment report release. The report was rather solid, with the NFP figure showing an increase of 678K and the Unemployment rate dropping to 3.8%, figures that were much better than the market’s expectations. The figures could be evidence that the US economy’s performance can be moving in red hot territory so far in 2022. This event may have been a big bet for the Federal Reserve which is keeping its eyes firmly on the most important indicators of the economy, possibly using them as a guidance or a metric for its own decision making. The FOMC’s upcoming meeting scheduled for the 15-16 of March could be a huge event for the Gold market since the central bank’s intentions in terms of rate hikes are still unclear. Though, a rate hike could be in the FOMC’s cards for the meeting, the size of the rate hike is still to be determined and could surprise market participants creating conditions for a session with intense volatility for the Gold market.
A key factor for traders to be mindful of in the following sessions is the current relationship between the USD and Gold. During the current week the Greenback has been lifted to a new yearly high, with the Dollar Index jumping to levels previously seen in May 2020. On the other hand, the Gold market today reached levels previously seen in August 2020 and is nearing the previous all-time high price which was nearby $2075 seen back then. The greenback could be appreciating as the US economy continues to display strength on multiple fronts possibly approaching pre pandemic levels, leaving aside supply bottle necks that continue to drive inflationary pressures. However, Gold’s impressive rise could be driven by global economic uncertainty and worry. Previously, investors and traders have used Gold to cover for the market’s insecurities over the economic growth moving forward and these worries can remain in the background, if tensions in Ukraine persist. Military intervention in Ukraine by Russia seems to remain a fact for the time being, yet the financial world is focusing more on the measures other nations are taking against Russia. The European Union and the US, are implementing rules that will be reducing their dependence on Russia for Energy supply, relating to both Oil and Gas. Moreover, Reuters noted in a report that the London Bullion Market Association (LBMA) suspended its authorization of six Russian precious metals refiners, meaning they will no longer be able to sell gold and silver in the London market. However, these actions have led to energy and agriculture commodity prices surging to new multiyear high levels, making the cost of goods even more expensive and subsequently adding to the already heightened market uncertainty. Finally, even though ceasefire talks have made headlines in the media, a swarm of refugees seems to be building up that could be worsening the situation.
Looking forward in the current week, the most significant economic release that can create strong volatility for the Gold market are the US Inflation data coming up on the 10th of March. The CPI and Core CPI rates for February are of major importance for economists and traders. Inflation data seems to motivate traders to stay ready, as Gold’s ability to be used as a counter tool for higher prices may come into play. At the same time and date, we also get the weekly Initial Jobless Claims figure. On the 11th of March we also get the notable Preliminary University of Michigan Economic Sentiment for March.
Technical Analysis
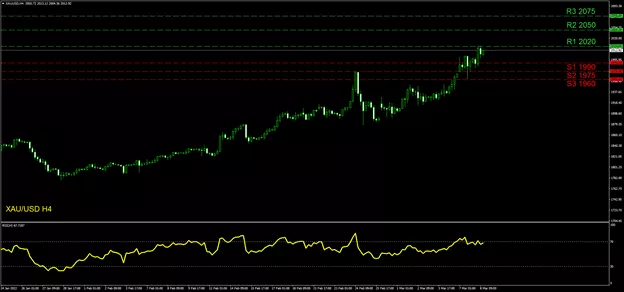
XAU/USD H4
During the most recent trading sessions Gold has elevated and reached our currently noted (R1) 2020 resistance which is a new multiyear high level. In case this level is breached, then we consider this a strong bullish sign that could possibly lead the price action towards the (R2) 2050 hurdle. At the top we also keep the (R3) 2075 level as a target for the bulls as it was the previous all-time high level for the yellow metal. Please note the (R2) and the (R3) levels were last seen in August 2020. On the contrary, if the sellers take over, the price action could be heading lower to test the (S1) 1990 support barrier. This level has been circulated by the price action in the recent sessions making it a possible first stop for the bears. If the selling is intensified, then the (S2) 1975 line could be next from our point of view. Lastly, the (S3) 1960 line can be used as a final support level, which was recognized previously as a resistance by traders. Overall Gold remains in an upward trend line according our personal view. The RSI indicator below our chart continues to run across the 70 level, confirming the buying orders are in excess currently.


