
In the past days, WTI continued to trade lower basically reversing the ground it gained in the previous week. We are currently going through a very interesting time for the Oil market, with a number of fundamental and geopolitical subjects eyed and the price action creating opportunities for traders. In this report, we will provide a clear and direct overview of the main subjects moving Oil prices. Our closing will consist of WTI’s technical analysis in order to present a complete investigation.
Today, all eyes are on the OPEC and non-OPEC Meeting which is expected to stick to plans for a modest increase in oil output in May. The scenario of keeping the OPEC group’s production increase very mild is a continuation of the strategy it used through the pandemic to keep supply in check. OPEC+ has boosted output targets by 400,000 barrels per day (bpd) each month since August 2021 while from May 1, the monthly target increase will rise slightly to 432,000 bpd. At the same time, one of the major OPEC plus members, Vladimir Putin’s Russia is currently under fire with sanctions from many nations due to its ongoing war on Ukraine. Russia’s contribution to the Oil market has been significant and the latest sanctions seem to be making its Oil less attractive. This has led to a few Western Oil companies and oil tankers to suspend operations with Russian Oil producers. The consequences of these actions have resulted in a notable reduction in global Oil output. Lower output combined with the ongoing increase in Oil demand seems to be pushing fuel and good prices higher, sending inflation rates to record high levels. Thus, the pressure on the global market is intensified at the moment, with inflation data in the US, the Eurozone, the UK and Japan increasing substantially. Some of the largest economies are attempting to find a way around from this vicious circle created. Different media sources claim the United States could be soon announcing an immense release of up to 180 million barrels from its strategic petroleum reserve as a great effort to cool crude oil prices. Even though this move is very noteworthy, it may ease temporary pressures but not resolve the problem completely. In the meantime, the news may be forcing WTI prices lower.
On a different note, the Oil market data released in the past days from the United States, may have increased volatility for Oil prices. During the past Friday US active Oil rigs surged to 531, the highest since April 2020 according to the Baker Hughes. The surge in active Oil rigs tends to signal elevated demand for Oil. Moreover, in the past days the API and the EIA weekly data displayed drawdowns of -3M and -3.45M barrels accordingly. Drawdowns have traditionally sent Oil prices higher upon release, yet news of the US extracting barrels from its strategic petroleum reserve could be more important for the market currently.
In addition, another important factor for Oil traders to consider are the Chinese government’s strict coronavirus measures in the city of Shanghai. This province is China’s commercial capital and by some calculations the biggest city in the country thus lockdown measures can significantly reduce Oil demand. Overall, China remains the largest Oil consumer on a global scale and traders should keep an eye on headlines for further or relaxed measures, as they can move Oil prices.
Technical Analysis
WTI H4
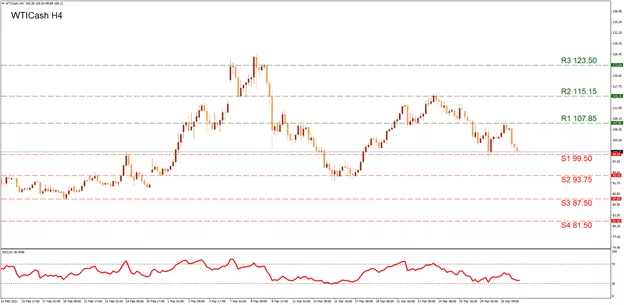
The most recent downward movement for WTI was formed since the 24th of March when the price action tested the currently noted (R2) 115.15 resistance. Yet with the selling in play the price action fell to test the (S1) 99.50 support and then proceeded to gain back some ground testing the (R1) 107.85 line. This may be evidence that the gray area between the (R2) 115.15 and the (S1) 99.50 on our chart, maybe crucial for understanding further price movement. In the scenario of an excessive bullish trend, we could see the (R3) 123.50 resistance, the multiyear high level becoming a target, once again. If the downward trend is extended in the following sessions and the price action falls below the (S1), we note the (S2) 93.75 which was tested on the 16th of March, as the most possible support. The next support level stands at the (S3) 87.50 which was used previously in February. In the scenario of a strong selling interest, we also note the (S4) 81.50 support level. The RSI indicator below our chart, is running across the 35-level providing evidence of the recent selling possibly stabilizing.


