
The US dollar rose during the American session as the market reacted to the latest minutes by the Federal Reserve. The minutes provided more color about the state of the bank’s officials as they try to lower the runaway inflation. Most officials agreed that the bank needs to do more in terms of lowering liquidity in the market. As a result, in addition to the 50 basis points rate hike they implemented, they signaled that more tightening was necessary. As such, the consensus is that the bank will hike interest rates by 0.50% in the upcoming two meetings and then start quantitative tightening.
The price of crude oil went sideways even after the US published the latest inventory data. According to the Energy Information Administration (EIA), the country’s oil inventories had a drawdown of over 1.01 million barrels. This was a smaller drawdown than the previous week’s 3.39 million barrels. The report showed that oil inventories at Cushing declined by more than 1 million barrels while weekly distillates stocks rose to 1.65 million barrels. Oil is also reacting to expectations that the global economy may be entering a period of recession or stagflation. For example, data from the US revealed that durable goods orders declined in April.
There are several important events scheduled today. In Turkey, the central bank is expected to deliver its decision. The expectation is that the bank will leave interest rates unchanged and signal more caution. In Mexico, the statistics agency will publish the latest retail sales numbers. Economists believe that the country’s sales rose by 2.7% in April. Meanwhile, in the United States, the government will release the pending home sales data. On Tuesday, data showed that new home sales declined by 16% in April. Other key data to watch will be the US GDP numbers.
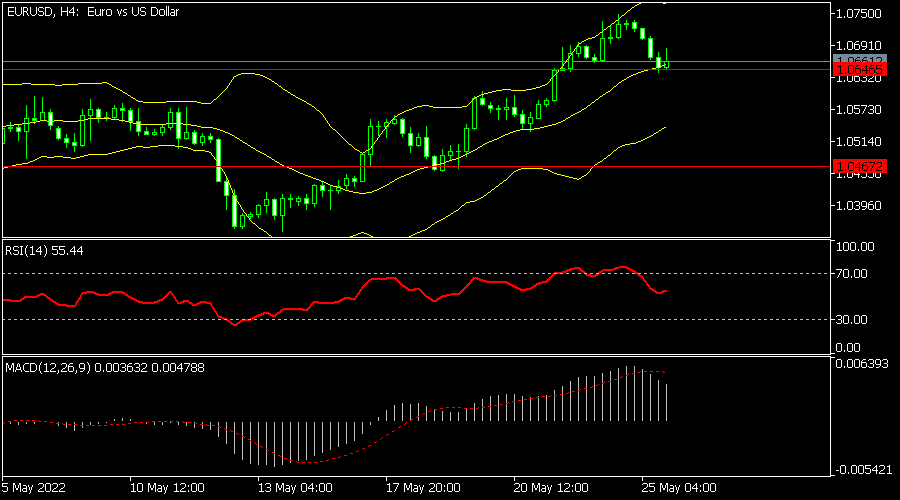
EURUSD
The EURUSD pair retreated to a low of 1.0645, which was the lowest point since Monday. This was a notable level since it was the highest point on May 4. The price is also along the middle line of the Bollinger Bands while the Relative Strength Index (RSI) has moved below the overbought level. The MACD remains above the neutral point. Therefore, the pair will likely resume the bullish trend since it has formed a break and retest pattern.
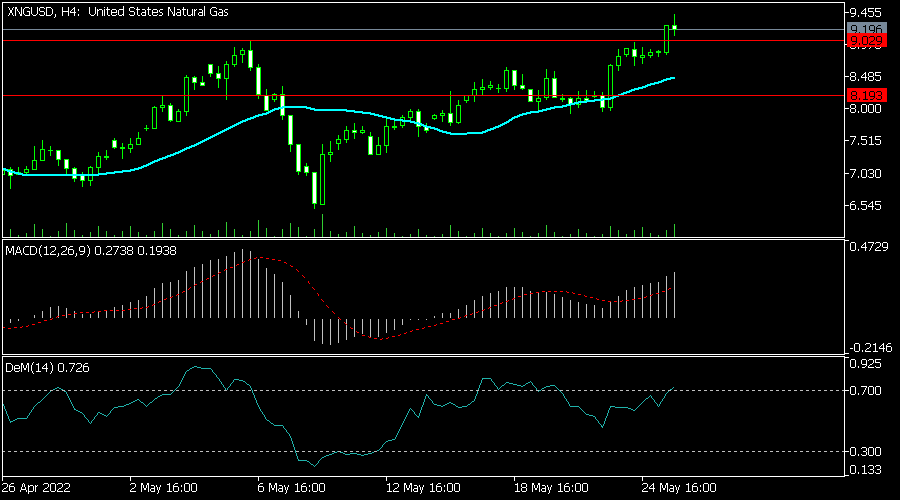
XNGUSD
The XNGUSD pair has maintained its bullish trend as demand for natural gas rose. The pair moved above the important resistance level at 9.02, which was the highest level on May 6. The pair moved above the 25-day moving average while the MACD and the DeMarker indicators continued rising. Therefore, the pair will likely keep rising, with the next key resistance level at 9.45.
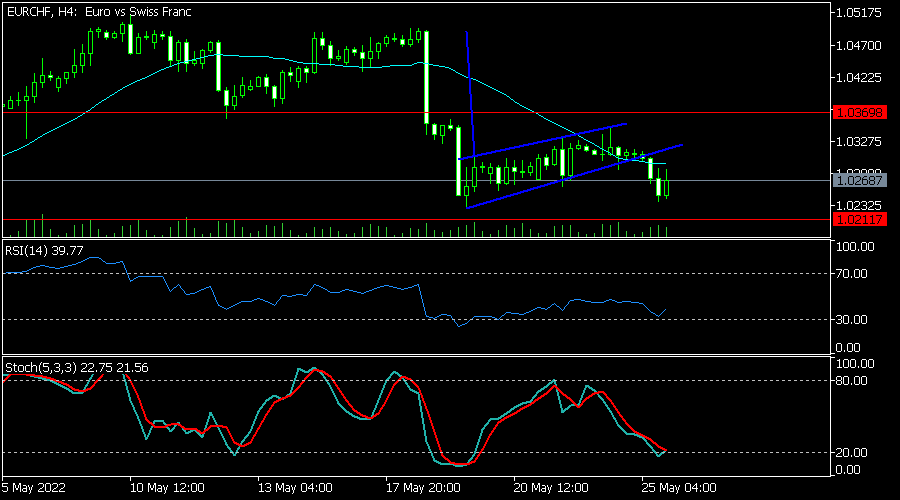
EURCHF
The EURCHF pair has been in a strong bearish trend for the past few days. The pair formed a bearish flag pattern that is shown in blue. This pattern is usually a bearish sign. The pair has moved below the 25-day and 50-day moving averages while the Relative Strength Index (RSI) has moved close to the overbought level. The pair will likely keep falling, with the next key support being at 1.0211.


