
U.S. Highlights
- Negotiators appeared close to a deal to raise the debt ceiling and set spending levels. However, the deal does not address Washington’s medium-term fiscal challenges, which were part of the reason Fitch put the U.S. on a negative watch.
- Consumers continued to spend at a healthy clip in April, contributing to sustained inflation pressures. We continue to expect spending to cool as the year goes on, helping to ease inflation, eventually.
- In the meantime, the Fed is in a tough spot. It will need courage to pause and wait for the full impact of its past tightening to show up.
Canadian Highlights
- According to the Survey of Employment Payrolls and Hours (SEPH) March’s employment fell 10k with both goods and services sectors posting declines.
- The number of job vacancies continued to fall with more sectors reporting fewer postings. This improvement, however, made no mark on the measure of labour market tightness, which remained unchanged from February.
- The SEPH also showed a continued deceleration in year-on-year estimates of wage growth but it is partially attributed to base effects and may reverse. All said, this week’s data doesn’t make a strong case for the BoC to come off the sidelines just yet.
U.S. – “Discretion” Is the Better Part of Valor in Washington
Thankfully, negotiators appeared close to a deal to raise the debt ceiling as of Friday morning. It looks like the two-year deal would cap discretionary spending and raise the debt ceiling through the 2024 election, avoiding the worst-case scenarios. However, ratings agency Fitch had cited the “failure of the U.S. authorities to meaningfully tackle medium-term fiscal challenges” as a reason for putting the U.S. on a negative watch, and this deal does not change that.
Congress has taken the Shakespearean proverb “discretion is the better part of valor” literally. The Bard’s original intention was a criticism of a lack of honour and courage in focusing on discretion. The debt ceiling deal only tinkers around the edges of the larger issue of a structural deficit on the order of 6% of GDP.
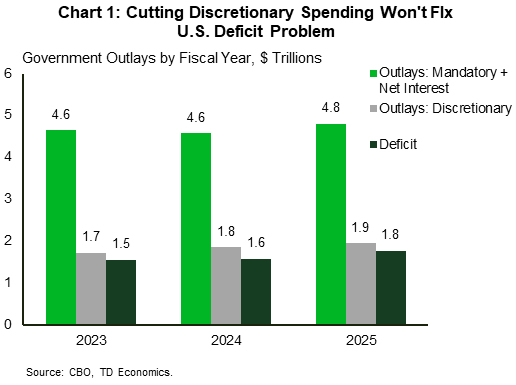
Discretionary spending accounts for only 27% of total federal government outlays, and the federal deficit is estimated to be $1.5 trillion in 2023. As shown in Chart 1, Congress would need to cut discretionary spending nearly to zero to balance the books if they only address discretionary spending. To seriously address the deficit, it needs to take the more courageous steps and look at mandatory spending – namely entitlements like social security and Medicare. Or, it needs to find a way to grow revenues at the same pace as population aging. Alas, courage seems in short supply in Congress these days.
Speaking of discretion in spending, real consumer spending was up a healthy 0.5% month-on-month in April. Spending was driven by robust gains in outlays on both goods and services. Monthly spending data has been very choppy over the past six months but comparing it to real income less transfer payments (which is a key recession indicator used by the NBER), you see that the upward trend in spending is outpacing real income growth (Chart 2).
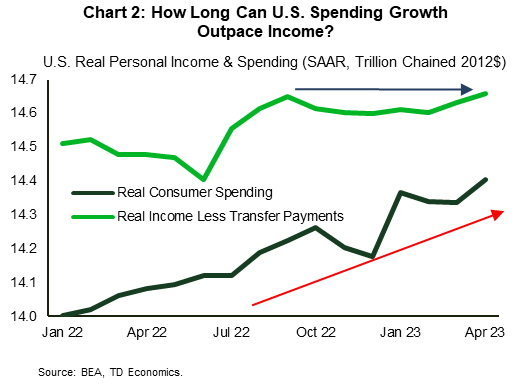
Thanks to a strong labor market, real income gains have held up. Added to the cushion of excess savings built up during the pandemic, the consumer has been able to keep spending in the face of very high inflation, in turn contributing to demand-driven inflation pressures. Chart 2 suggests that spending is set to slow – even if the labor market doesn’t cool. About 60% of the excess savings cushion has been spent, and spending cannot outgrow income indefinitely before consumers will need to tighten their belts.
We expect that belt tightening to be in greater evidence as the year goes on. After consumer spending grew by 3.8% annualized in Q1, it is tracking a more modest 2% in Q2. We expect it to fall below 1% in the second half of the year, which will help to dampen inflationary pressures. Until then, the Fed is on the horns of a dilemma.
Its preferred inflation gauge, the core PCE deflator, remained around where it has been all year at 4.7% year/year in April. Markets are judging this could mean the Fed should push a bit harder on rates, with market odds tilting slightly in favor of another hike in June. We believe that the Fed will need to hold its courage and pause and assess the impact of the significant monetary policy tightening that has not yet had its full impact on economic growth.
Canada – SEPH Adds Brushstrokes to Labour Landscape
Second quarter bank earnings and investor sentiment around the U.S. debt-ceiling negotiations were the two factors moving equity markets this week, with the TSX tracking 2% lower at the time of writing. Meanwhile, economic data was in short supply. The most important release was the Survey of Employment Payrolls and Hours (SEPH) for the month of March. Relative to the household survey, SEPH is less timely as it provides employment measures with a two-month lag and captures only payroll employees, excluding self-employed. Still, the survey is closely watched as it provides additional insights into earnings and industry-level payrolls, as well as measures of labour demand.
According to the SEPH, employment fell 10k in March, led by declines in the goods producing sector, with construction and manufacturing reporting the largest losses which were only partially offset by gains in utilities – the only industry with an increase in hiring. This is comparable with estimates reported by the household survey for the month of March. However, within the services sector, payrolls declined by 17k, while households reported growth of 35k.
The demand side of the labour market showed marginal easing in March. The number of job vacancies was down by 17k, resulting in a cumulative contraction of 56k since the beginning of the year and 188k relative to May 2022 (when job vacancies reached their peak). Since then, the number of unfilled positions declined by more than 20k in accommodation & food services, manufacturing, trade and professional services – industries that jointly accounted for more than half of the change in labor demand (Chart 1).

The improvement in March, made no mark on the measure of labour market tightness. The ratio of jobs points to unemployed remained at 0.8 – unchanged from February. This is still much higher than an average of 0.5 vacancies per unemployed observed in 2019. Based on the current level of employment, we would need to vacancies to fall by roughly another 300k in order to restore better balance in the labour market and help normalize wage pressures.
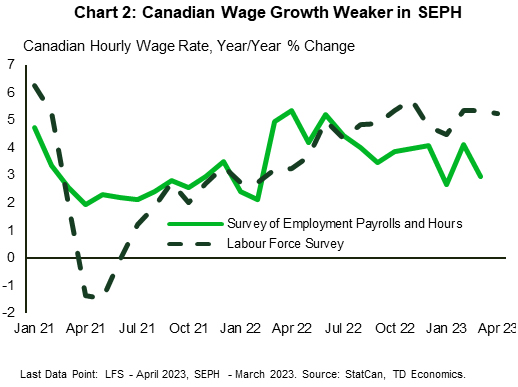
Speaking of wages, the SEPH showed a continued deceleration in year-on-year estimates of average hourly earnings to 3.0% in March (from 4.1% in February). However, the loss in momentum is partially attributed to base effects as it’s measured against a sizeable spike in March of last year, which could reverse in the following months. In addition, the more recent measure of wage growth as reported by the Labour Force Survey remains elevated at 5% – a significant divergence from the SEPH estimate (Chart 2). Evidently, the path to normalization in the job market won’t feel like a downhill journey.
It sure doesn’t for small business owners. According to May’s small business barometer, wage costs remain the biggest concern, with 68% of them reporting elevated labour costs as the biggest headwind businesses are facing today. With that, average wage increase plans for the next year were softer at 3.2%. All told, this week’s data provides additional information on the labour market situation, but doesn’t make a strong case for the BoC to come off the sidelines just yet, even if markets have started to price another 25 basis point hike next month.


