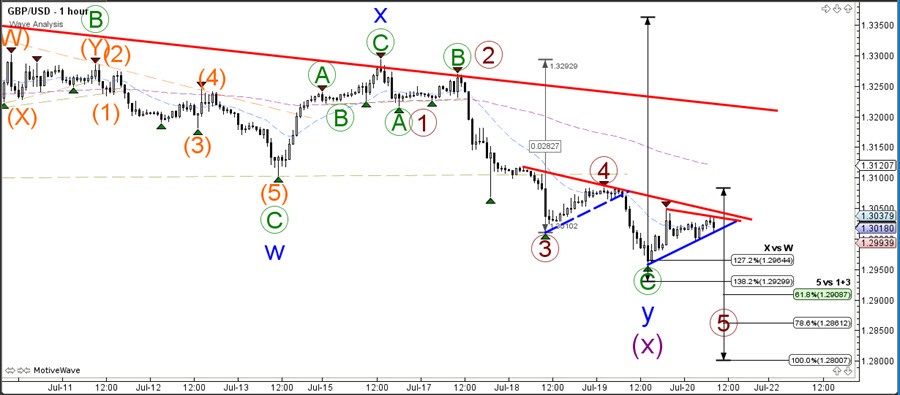
The GBP/USD has reached a key decision zone, which is the support line (blue) of the downtrend channel. The GU will either make a bullish bounce to confirm an expanded WXY (purple) correction or price will break for a continuation of the downtrend via a potential wave 3 (purple).
The GBP/USD break below the 138.2% Fibonacci level would invalidate the wave X (pattern) and confirm an impulsive price swing and wave pattern.
The GBP/USD is building a triangle chart pattern which lends itself for a renewed breakout potential. A bullish break indicates space towards the next resistance level (red) whereas a bearish breakout below support (blue) could indicate a downtrend continuation.