
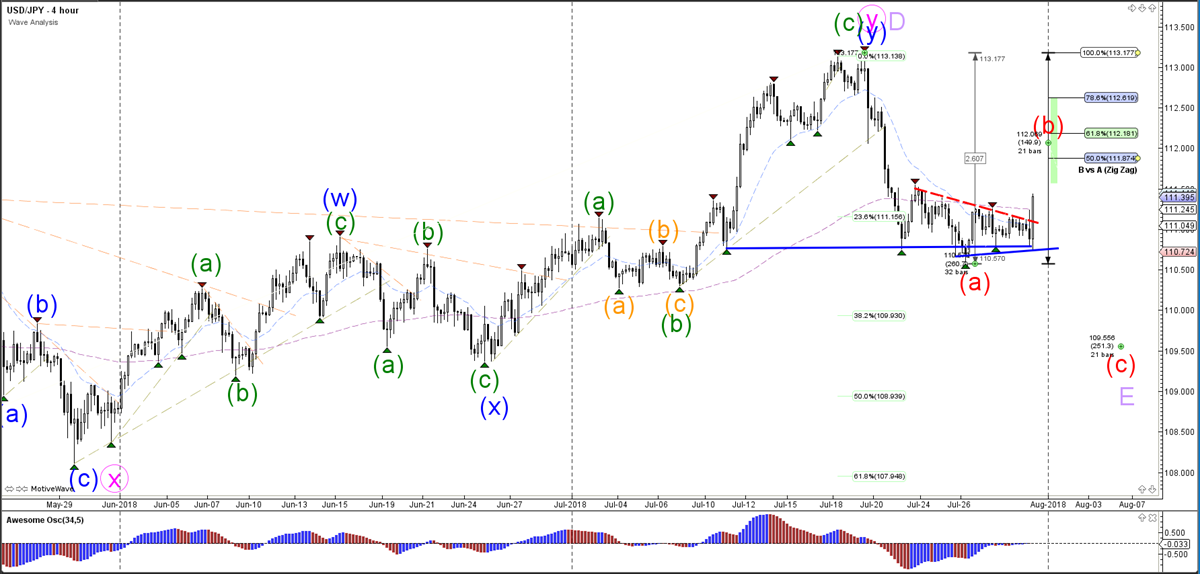
The USD/JPY is breaking above the resistance trend line (dotted red) of the triangle chart pattern, which is indicating a potential bullish breakout. However, if price is indeed in a wave B (red) of a larger wave E (purple), then price should bounce at the Fibonacci levels of wave B vs A. A break above the 100% Fib level invalidates the ABC (red) patterns and could indicate an uptrend continuation.
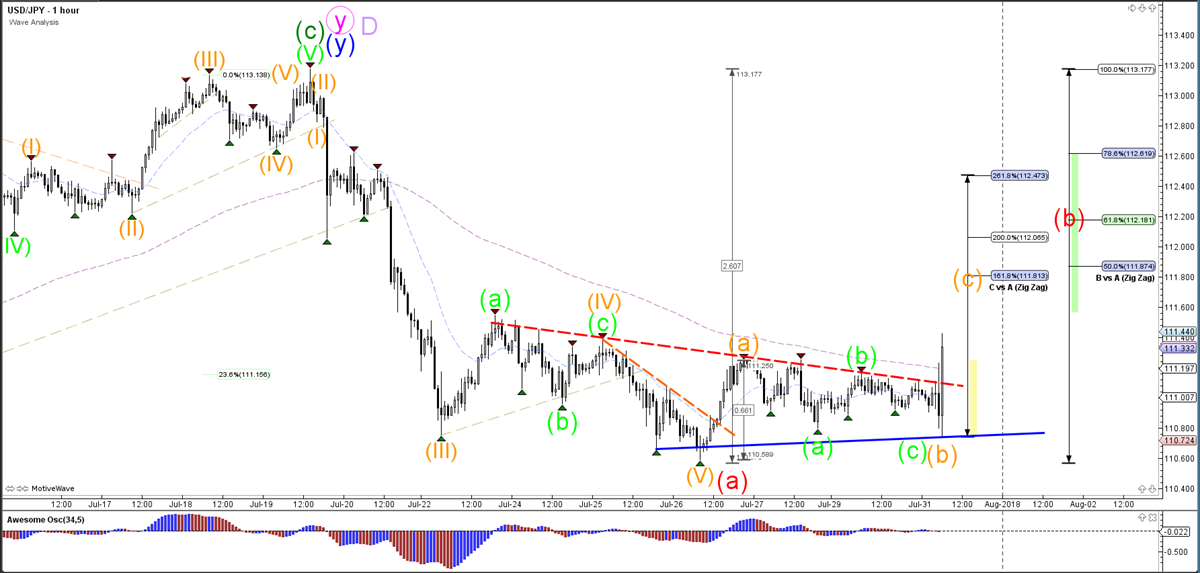
The USD/JPY seems to have completed and ABC (green) within wave B (orange). Price could now be ready for an impulsive and bullish wave C (orange) if price manages to break above the resistance trend line (dotted red) with a strong candle.


