EUR/USD
The EUR/USD pair closed the day marginally lower around 1.0880, down for a second consecutive, despite positive macroeconomic data released earlier on the day, as attention centered in the ECB’s monetary policy decision. Market players ignored positive figures coming from Germany, where consumer confidence advanced further for May according to the GFK survey, which printed 10.2 against previous 9.8. Inflation in the country is expected to remain flat in April, better than the 0.1% decline forecasted, while yearly basis, is expected to have risen to 2.0% from previous 1.6%. Business sentiment improved in the EU although consumer sentiment remained unchanged at -3.6. As for the ECB, the Central Bank left its monetary policy unchanged, and even indicated confidence in the economic growth, with the risk seen more balanced. The picture however, was not that good for inflation, with policymakers indicating that the accommodative monetary policy will persists amid underlying inflation still being subdued. Additionally, the Central Bank said they did not discuss tapering.
After surging to 1.0932, the pair fell down to 1.0851, as disappointing US data kept the greenback in check across the board. Initial jobless claims rose to 257K worse than the 241K expected in the week ending April 21st, whilst eh goods trade deficit expanded to $65 billion in March. Durable Goods Orders for the same month rose just by 0.7%, missing expectations of a 1.2% advance, while the core figure fell by 0.2%, against the 0.4% forecasted. Finally, pending home sales fell in March by 0.8%, less than market’s forecast of a 1.0% decline.
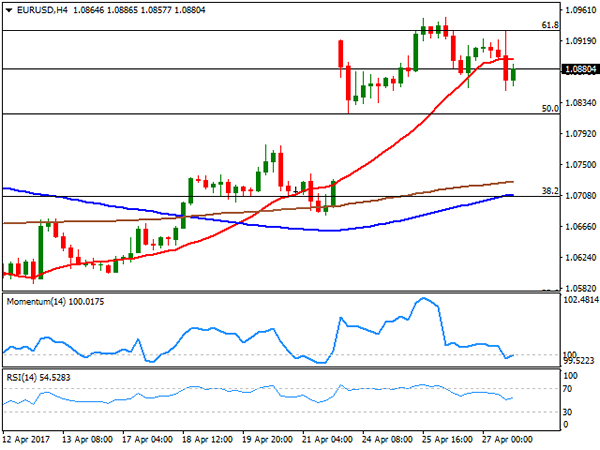
From a technical point of view, the pair continues consolidating its recent gains, although the upward potential has somehow faded, after another failed attempt to surpass the key resistance around 1.0930, the 61.8% retracement of the post-US election slide. The 4 hours chart, shows that the price settled below its 20 SMA for the first time this week, while technical indicators continued retreating, now flat around their mid-lines. Sellers stand in the area between the mentioned Fibonacci resistance and the weekly high of 1.0950, this last the level to surpass to confirm an upward extension, while below the weekly low of 1.0820, the weekly low and another Fibonacci support, the risk will turn towards the downside, with the pair targeting then 1.0730, the unfilled weekly opening gap.
Support levels: 1.0855 1.0820 1.0785
Resistance levels: 1.0910 1.0950 1.1000
USD/JPY
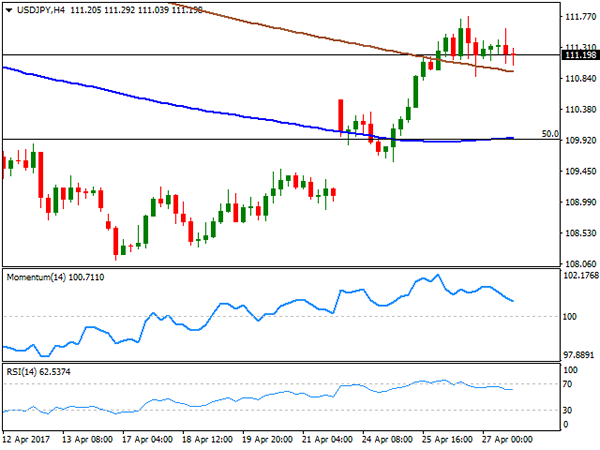
The USD/JPY pair traded uneventfully for a second consecutive day, erasing its intraday gains in the US afternoon, and settling pretty much flat around 111.20. The Bank of Japan monetary policy meeting barely affected the pair, as the ongoing policy was maintained unchanged. Policy makers raised the economic forecast, increasing its real GDP growth forecast for the 2017-18 fiscal year to 1.6% from the 1.5% projected in January, butt lowered its core inflation growth forecast to 1.4% from 1.5% in the same period. The yen found some support on falling US yields, following Draghi’s statement, with the 10-year benchmark down to 2.29% from 2.31%. The pair traded within Wednesday’s range, lacking directional strength ahead of Friday’s opening. Japan will release a batch of first-tier data including National and Tokyo inflation, unemployment, industrial production and retail sales. The 4 hours chart shows that approaches to the 200 SMA continued to attract buying interest, but that the Momentum indicator extended its decline within positive territory, indicating decreasing buying interest. The RSI indicator in the mentioned chart remains flat around 60. The downside potential seems limited as long as the price holds above the mentioned SMA, currently around 110.95, while only beyond 112.00 the pair will be poised to resume its advance.
Support levels: 110.95 110.60 110.20
Resistance levels: 111.60 112.00 112.45
GBP/USD
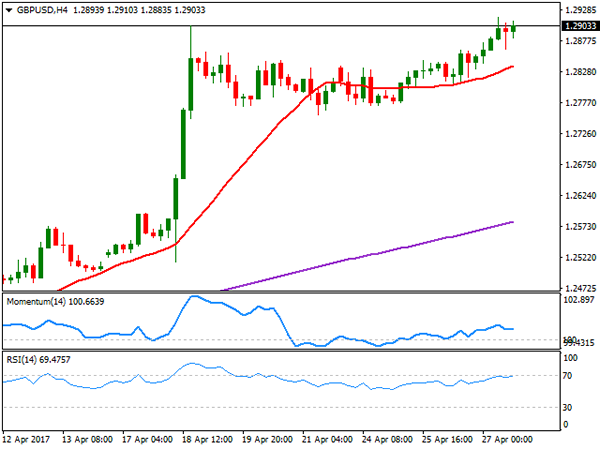
The GBP/USD pair surpassed its previous 2017 by a few pips, printing 1.2916 at the beginning of the European session, and settling above 1.2900. Grinding slowly higher, the absence of first-tier data or fresh Brexit headlines prevented the pair from advancing further, but the outlook remains bullish for the pair, although it will suffer a macroeconomic challenge this Friday, when it will release the first estimate of the Q1 GDP. The economy is expected to have grew by 0.4% in the three months to March, following a 0.7% advance in the previous quarter. In the meantime the pair remains near the mentioned high, and the 4 hours chart shows that the price remains above a recovering 20 SMA, whilst the RSI indicator continues consolidating near overbought levels and the Momentum indicator within positive territory. An acceleration through 1.2920, should favor additional gains, towards 1.2960 first, and up to 1.2710 afterwards.
Support levels: 1.2870 1.2830 1.2795
Resistance levels: 1.2920 1.2960 1.3010
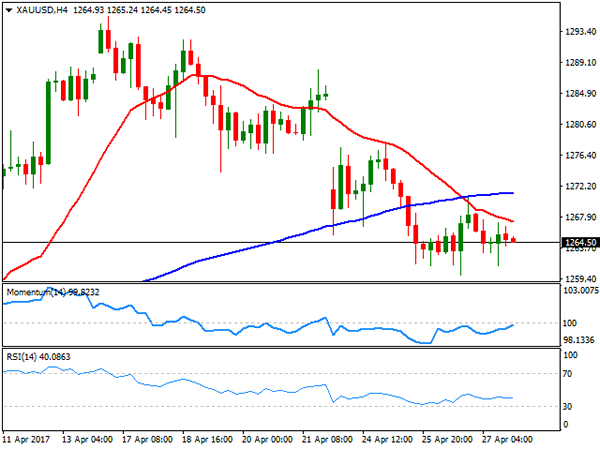
GOLD
The GBP/USD pair surpassed its previous 2017 by a few pips, printing 1.2916 at the beginning of the European session, and settling above 1.2900. Grinding slowly higher, the absence of first-tier data or fresh Brexit headlines prevented the pair from advancing further, but the outlook remains bullish for the pair, although it will suffer a macroeconomic challenge this Friday, when it will release the first estimate of the Q1 GDP. The economy is expected to have grew by 0.4% in the three months to March, following a 0.7% advance in the previous quarter. In the meantime the pair remains near the mentioned high, and the 4 hours chart shows that the price remains above a recovering 20 SMA, whilst the RSI indicator continues consolidating near overbought levels and the Momentum indicator within positive territory. An acceleration through 1.2920, should favor additional gains, towards 1.2960 first, and up to 1.2710 afterwards.
Support levels: 1.2870 1.2830 1.2795
Resistance levels: 1.2920 1.2960 1.3010
WTI CRUDE OIL
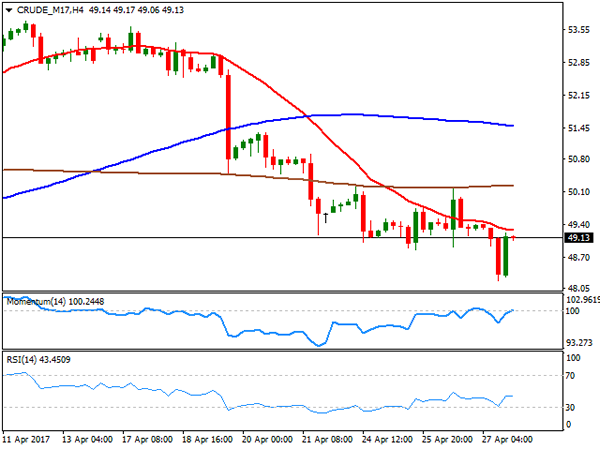
Crude oil prices plunged at the beginning of the day, with West Texas Intermediate crude futures printing a fresh 4-week low of $48.21 a barrel on news that Libya have resumed oil pumping for export in two key oilfields. The commodity, however, trimmed most of its intraday losses ahead of Wall Street’s close, ending the day at $49.20 a barrel, as the dollar weakened in the US session following the release of soft local data. WTI retains a negative outlook, as in the daily chart, the price continued developing well below all of its moving averages, whilst technical indicators head south within bearish territory. In the 4 hours chart, the price is also below its moving averages, with the 20 SMA acting as an immediate resistance at 49.30, while technical indicators recovered within negative territory, but pared gains and turned flat around their mid-lines.
Support levels: 48.85 48.20 47.70
Resistance levels: 49.30 49.80 50.30
DJIA
Wall Street posted modest gains this Thursday, with the DJIA up 6 points, to 20,981.33 and the S&P surging by 0.06% to 2,388.77. The Nasdaq Composite out-stood, adding 23 points to 6,048.94, a record close. Amazon released its earnings report right after the close, hitting record highs after a positive statement, although Microsoft edged lower in the same scenario. Within the Dow, Home Depot was the best performer, adding 1.21% followed by Intel that added 1.18%. El du Pont lead declines with a 1.90% decline, followed by Caterpillar that shed 1.73%. Technically, the daily chart for the index shows that indicators lost directional strength within positive territory, but also that it holds above its moving averages, with the risk still towards the upside. In the shorter term, and according to the 4 hours chart, the index is barely holding above a bullish 20 SMA, this last at 20,945, while technical indicators head lower, indicating a possible downward corrective move on a break below the mentioned SMA.
Support levels: 20,945 20,914 20,869
Resistance levels: 21,035 21,071 22,010

FTSE100
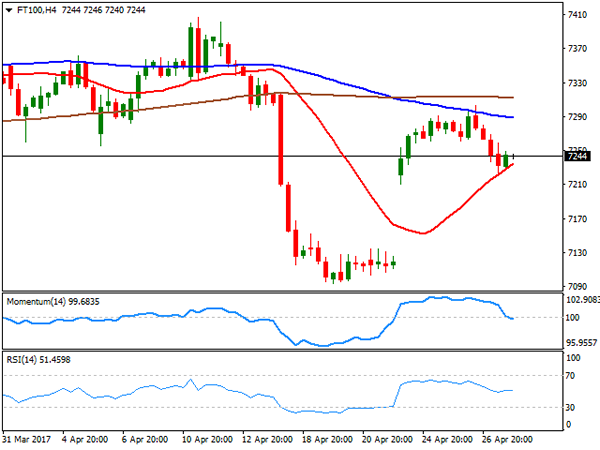
London shares followed the lead of European indexes, with the Footsie down 51 points daily basis to end at 7,237.17, undermined by persistent Pound’s strength and weaker base metals. Despite banks were under pressure, Lloyds Banking group was among the best performers, ending the day up 2.31% after a positive earnings report. BHB Billiton led decliners, down 4.75%, followed by Glencore that shed 3.15% and Fresnillo that closed down 2.73%. Daily basis, the index is contained to the upside by a bearish 20 DMA, but holding above a bullish 100 DMA, this last at 7,218, the level to break to see further declines. Indicators in the mentioned time frame hold within negative territory, with the RSI turning modestly lower. In the 4 hours chart, a bullish 20 SMA attracted some short term buying interest, but the recovery has been limited, while technical indicators are biased lower within neutral territory, in line with the longer term perspective.
Support levels: 7,218 7,173 7,126
Resistance levels: 7,259 7,303 7,340
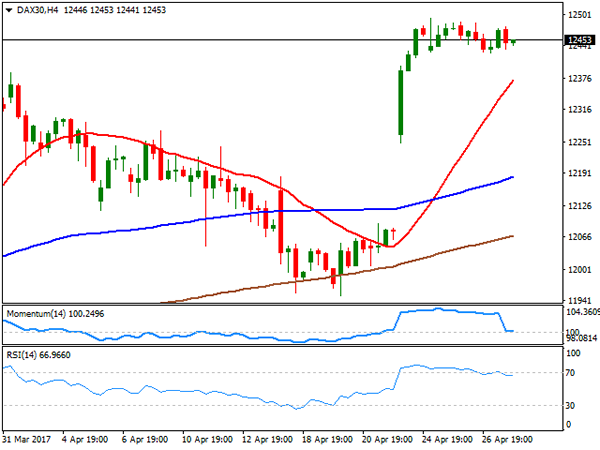
DAX
European major benchmarks closed mostly lower this Thursday, with the German DAX settling at 12,443.79, down by 29 points or 0.23%, with banks and automotive shares leading the way lower in the country. Despite an encouraging earnings report, Deutsche Bank plunged at the beginning of the day, ending 3.41% lower amid the increased earnings were achieved on the back of revenues around 9.0% lower, at 7.3 billion Euros. Bayer on the other hand, was the best performer, adding 4.33%. The daily chart shows that the index continued to consolidate at the upper end of its weekly range, maintaining a positive technical outlook given that it remains far above bullish moving averages, whilst technical indicators have resumed their advances within positive territory. In the 4 hours chart, the Momentum retreated towards its 100 level, but the RSI indicator holds around 66 as the 20 SMA maintains a strong bullish slope well below the current level, supporting some additional gains on a break above 12,495, the weekly high.
Support levels: 12,418 12,366 12,312
Resistance levels: 12,495 12,530 12,585