
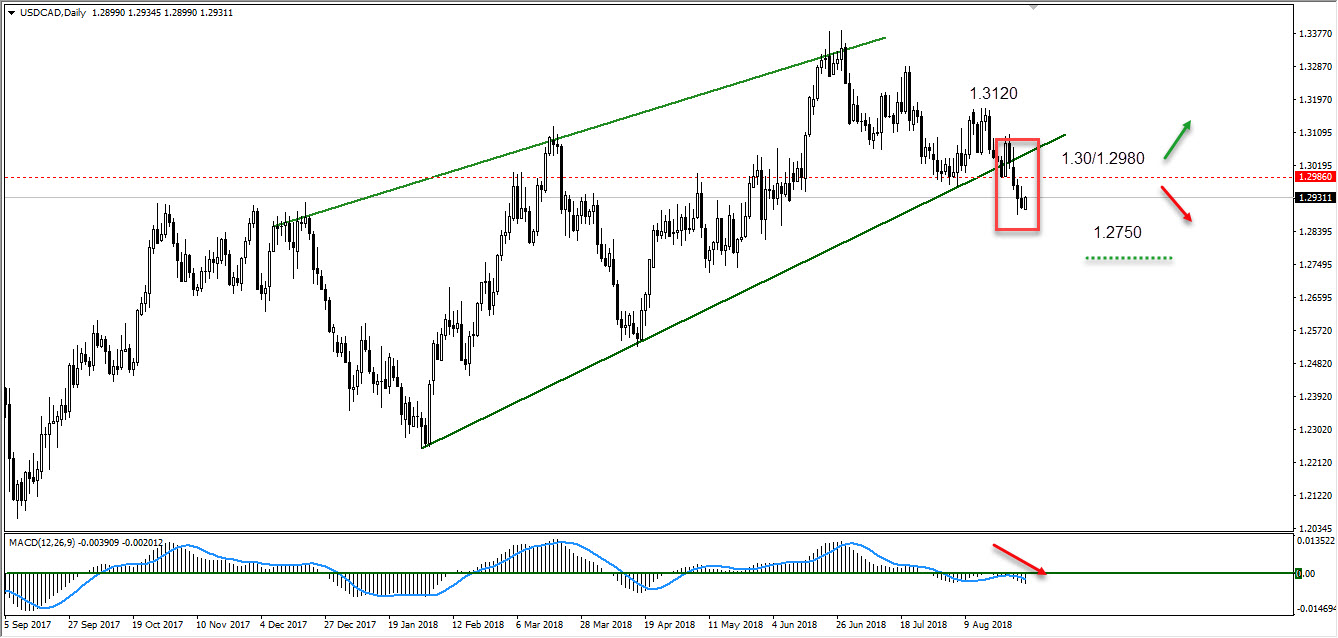
The chart below on a daily time-frame shows the pair USD/CAD trading in a down trend. In addition, it shows that the pair over the past month had begun to gradually decrease and as of now this movement is in full momentum.
The price which is currently at $1.2931 clearly shown on the chart had recently experienced a bearish breakout and is now expected to trade towards the support zone (colored in green) which is priced at $1.2750. The chart shows that the bears are in full dominance and control which is highly likely to continue as the price declines.
Major support: 1.2750
Major resistance: 1.30/1.2980
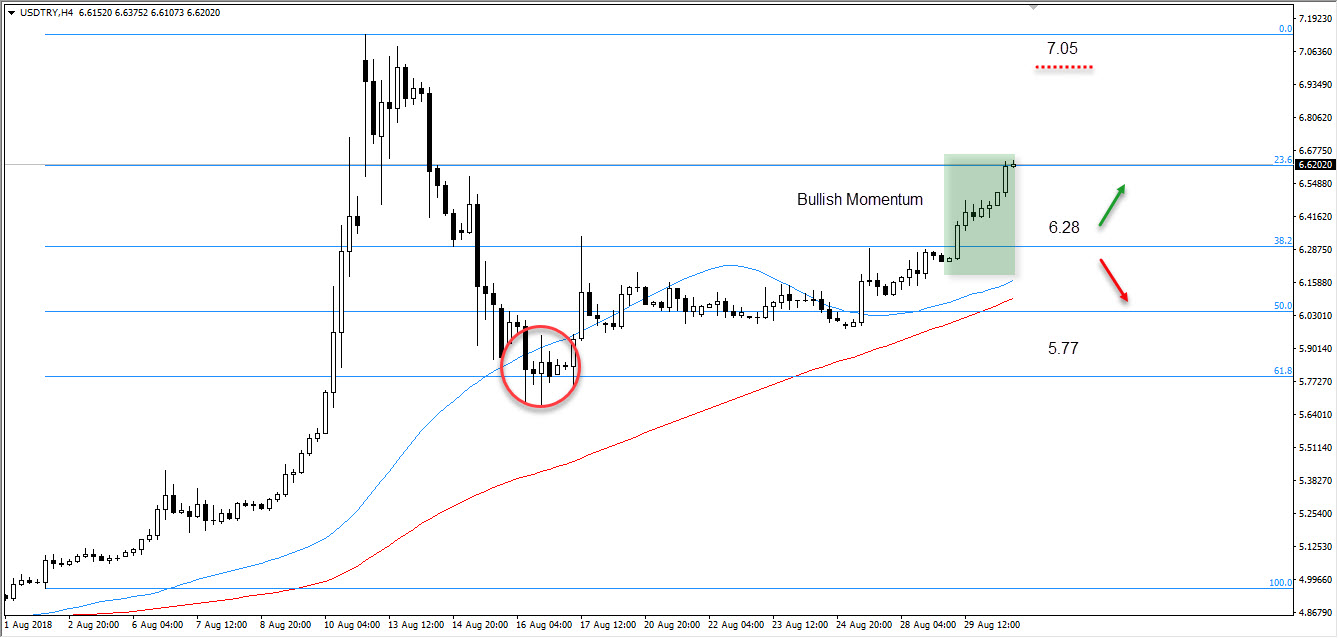
USDTRY
chart shows a similar pattern circled in red on the chart where a downside retracement had taken place. It is highly expected that a similar pattern may be taking place at present where the price is expected to continue to trade up towards the resistance zone (colored in red) which is priced at $7.05.
Moreover, there may also be a retest at this point of resistance. Additionally, this is evidently backed up by the green rectangle on the chart which signifies the bullish momentum taking place amongst the markets for the pair USD/TRY.
Major support: 5.77
Major resistance: 7.05


