
Key Highlights
- The US Dollar recovered nicely after testing the 110.00 support against the Japanese Yen.
- There are two key bullish trend lines in place with support near 110.80 on the daily chart of USD/JPY.
- The US Consumer Price Index in August 2018 increased 0.2%, compared with the +0.3% forecast.
- Today, the US Retail Sales for August 2018 will be released, which is forecasted to rise 0.4% (MoM).
USDJPY Technical Analysis
This past week, the US Dollar declined, but it found support above 110.00 against the Japanese Yen. The USD/JPY pair moved higher this week and it could continue to move higher towards 112.80 in the near term.
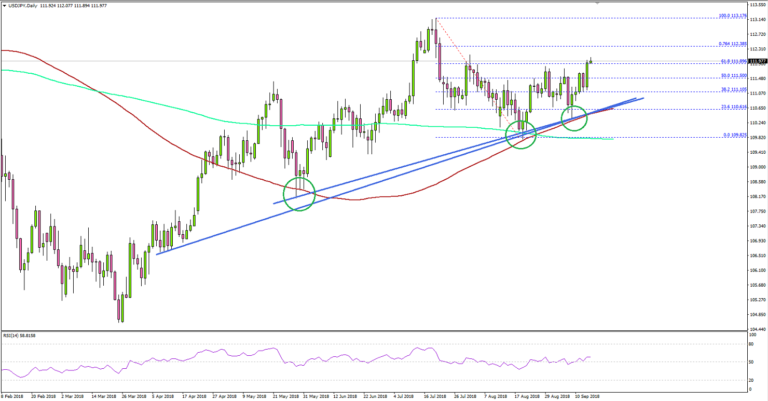
Looking at the daily chart, the pair started a fresh upward move from the 110.40 swing low. It seems like the 110.00 zone is a strong support along with the 100-day simple moving average (red).
More importantly, the pair found bids near two key bullish trend lines in place with current support near 110.80 on the same chart. The pair moved above the 111.50 resistance and the 50% Fib retracement level of the last drop from the 113.17 high to 109.82 low.
If the pair accelerates above the 112.00 and 112.10 resistance levels, there could be a test of the 76.4% Fib retracement level of the last drop from the 113.17 high to 109.82 low at 112.38. Above 112.40, the pair will most likely retest the last swing high at 113.17.
On the flip side, if there is a downside correction, the 111.00 level is an initial support, followed by the trend lines at 110.80.
Fundamentally, the US Consumer Price Index for August 2018 was released by the US Bureau of Labor Statistics. The market was looking for a rise of 0.3% in the CPI compared with the previous month.
However, the result was disappointing as the CPI increased 0.2% and the yearly change came in at 2.7%, less than the forecast of 2.8%. Looking at the Consumer Price Index (CPI) Ex Food & Energy, there was a rise of 2.2% (YoY), less than the 2.4% forecast.
The report added:
The energy index increased 1.9 percent in August; a 3.0-percent increase in the gasoline index was the largest factor, but the other energy component indexes also rose. The shelter index increased 0.3 percent in August, the same increase as in July. The food index rose only slightly in August, with the index for food at home unchanged.
There was a slight increase in selling pressure on the greenback as EUR/USD and GBP/USD extended gains. However, major dips in USD/JPY towards the 110.80 level remains supported.
Economic Releases to Watch Today
- US Retail Sales August 2018 (MoM) – Forecast +0.4%, versus +0.5% previous.
- US Industrial Production August 2018 (MoM) – Forecast 0.3%, versus +0.1% previous.
- US Capacity Utilization August 2018 – Forecast 78.2%, versus 78.1% previous.


