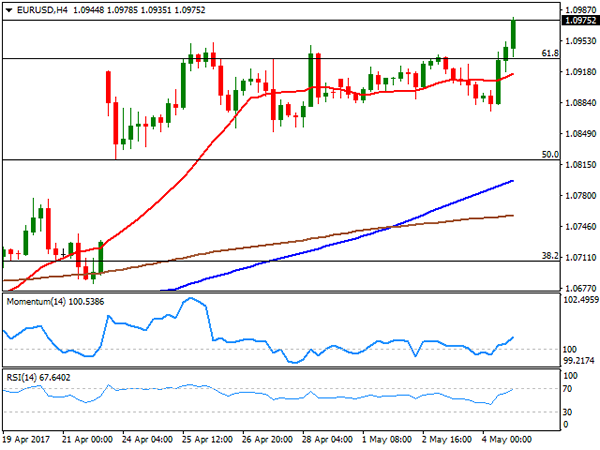
EUR/USD
The EUR/USD pair not only trimmed the late Wednesday shallow FED-triggered losses, but also managed to surge to a fresh 2017 high of 1.0978 in the American afternoon, holding nearby by the end of the end. The American dollar came under pressure early London, following another round of strong European data, as the final Markit services and composite PMIs for the region confirmed growth accelerated to its fastest pace in six-years at the beginning of the second quarter. April EU composite PMI printed 56.4, better than the initial estimate of 56.2, while German reading came at 56.7, also beating preliminary estimates, but below March’s peak of 57.1.
European equities rallied, helping Wall Street to open higher, but US stocks were unable to hold on to gains, plummeting alongside with the greenback, despite some positive minor employment reports. Weekly unemployment claims fell by more than expected in the week ending April 29, down to 238K from a previously unrevised 257K. During the first quarter of the year, the Unit labor cost in the country rose by 3.0%, beating expectations, although labor productivity in the nonfarm business sector decrease at an annual rate by 0.6%. The US will release its monthly Nonfarm Payroll report this Friday, although seems it would be able to do little for the greenback, even if the number surprises to the upside, as the Fed has already offered its stance, and is not worried about employment. Another negative surprise, on the other hand, will probably have a major effect on the market, fueling dollar’s losses against its high-yielding counterparts.
From a technical point of view, the pair is now bullish, facing an immediate resistance at the 1.1000 psychological level, but given the latest bullish breakout, chances are of another leg higher through it. In the 4 hours chart, the 20 SMA has gained some upward strength far below the current level, whilst technical indicators finally detached from their mid-lines, heading higher within positive territory. Additionally, the pair was trading around 1.1020 ahead of the outcome of the US election last November, which means that if the price manages to settle above it ahead of the weekly close, the pair has scope to extend its rally up to 1.1260 next week.
Support levels:1.0950 1.0900 1.0855
Resistance levels: 1.1000 1.1045 1.1080
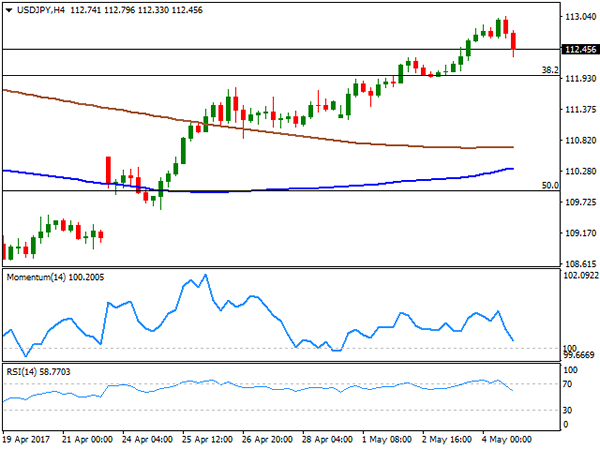
USD/JPY
The USD/JPY pair traded as high as 113.04, level last seen mid March, before turning sharply lower and ending the day in the red around 112.45, as dollar’s bulls gave up in the American session. There was not a certain catalyst behind the negative sentiment towards the US currency, although the movement accelerated after the DYX broke below the 99.00 level, not flirting with its weekly lows. US stocks plunged but trimmed half of their daily losses ahead of the close, while US Treasury yields surged to fresh weekly highs, limiting yen’s gains. The pair briefly surpassed its 100 DMA but stands now a few pips below it, unable to confirm the break of the critical dynamic resistance, currently at 112.50. In the 4 hours chart, technical indicators have pulled sharply lower from overbought levels, now nearing their mid-lines but still holding within positive territory, whilst the 100 SMA kept advancing far below the current level, and the 200 SMA. The bearish move can extend intraday down to 112.00, without actually affecting the dominant trend, although below this last, the risk turns towards the downside, targeting the 111.20.
Support levels: 112.00 111.60 111.20
Resistance levels: 112.45 112.90 113.30
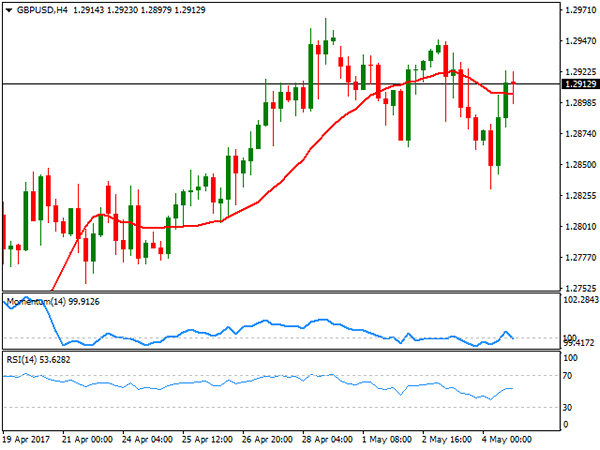
GBP/USD
The British Pound ended up recovering the 1.2900 level against the greenback, after the pair fell down to a fresh weekly low of 1.2830. The GBP/USD found a reason to recover the upside in the April UK Markit services PMI, as the index surged to a four-month high of 55.8, amid strong demand from overseas that offset local consumer spending, according to the official report. On a down note, mortgage approvals fell to a six-month low in March, down to 66,837 from 67,926 in February, a result of higher inflation. Also, households’ M4 flows softened a little further and were £3.0 billion, while private non-financial corporations’ M4 flows picked up to £3.5 billion, and were above the recent average flows. From a technical point of view, the upward potential seems limited as the pair has set a lower low and a lower high daily basis, although it would take an extension below 1.2770 to confirm a steeper slide in the pair. In the 4 hours chart, the technical outlook remains neutral, with the price still hovering around a horizontal 20 SMA, and indicators unable to move away from their mid-lines.
Support levels: 1.2880 1.2830 1.2795
Resistance levels: 1.2965 1.3010 1.3060
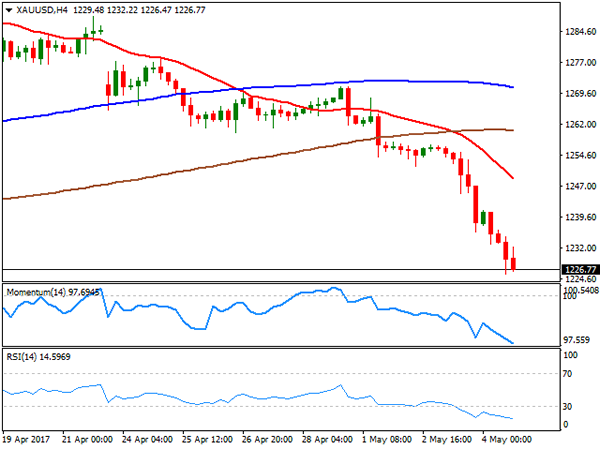
GOLD
Gold prices plunged this Thursday, with spot ending the day at $1,226.50 a troy ounce, in spite of broad dollar’s weakness. The commodity fell to its lowest in seven weeks, still undermine by US Federal Reserve upbeat tone late Wednesday, which supported the case for a rate hike in June, and receding political uncertainty in Europe, moreover after French centrist candidate, Emmanuel Macron, was seen as the "most convincing" candidate after the televised debate. From a technical point of view, gold is set to continue falling, given that in the daily chart, it broke below its 100 DMA for the first time since late January, now trading below all of its moving averages, whilst technical indicators maintain strong bearish slopes within negative territory. In the shorter term, and according to the 4 hours chart, the metal is also biased lower, as technical indicators maintain their strong downward momentum, despite being in extreme oversold territory, whilst the 20 SMA turned sharply lower after breaking below the largest ones.
Support levels: 1,225.60 1,214.10 1,203.80
Resistance levels: 1,232.60 1,242.50 1,250.90
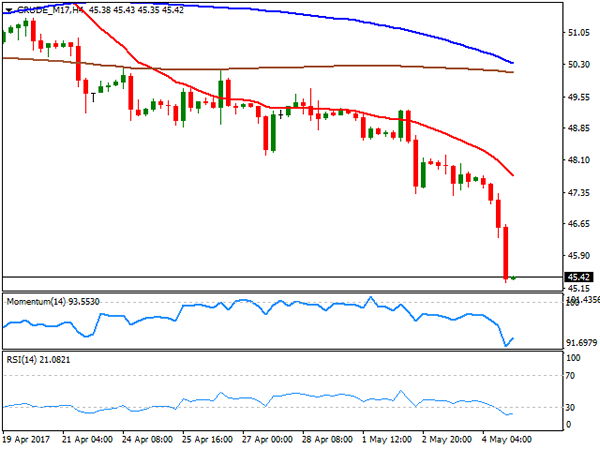
WTI CRUDE OIL
Crude oil prices fell to their lowest in six months, with West Texas Intermediate crude futures plummeting almost 5% daily basis to $45.28 a barrel. The slide came after OPEC delegates downplayed chances of a deeper output cut, despite an extension beyond June is still on the table. News that the political tensions are set to decrease in Libya as two of the country’s largest fractions made progress towards a deal, fueled the decline as the country’s production could rise to 1.5 million barrels in a few months. The OPEC is meeting by the end of this month in Vienna. After the sharp decline, technical indicators in the daily chart entered oversold territory, maintaining their strong downward slopes at the end of the day, supporting some additional declines ahead. In the 4 hours chart technical indicators have pared losses but remain at oversold levels, whilst the bearish 20 SMA turned sharply lower, now around 47.75. The 45 figure has proved strong in the past, although a break below the level is now possible, with scope then to test the 42.50 region.
Support levels: 47.10 46.60 46.00
Resistance levels: 47.90 48.50 49.20
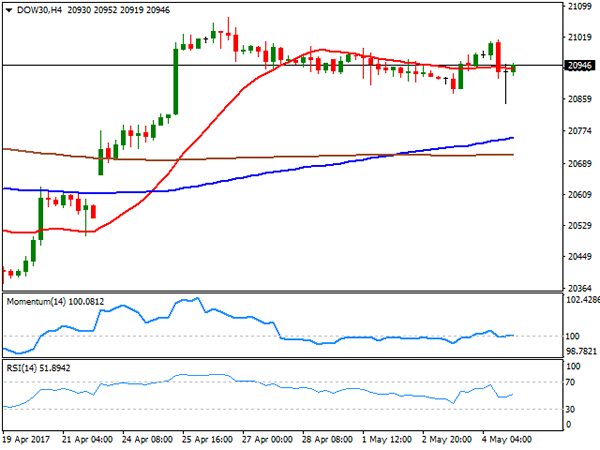
DJIA
Wall Street closed mixed, but not far away from its opening levels, trimming sharp intraday losses. After starting the session with a strong footing, following the lead of European equities, US stocks plunged, with the DJIA trading almost 100 points lower at one point, to finally settle for the day at 20,951.47, down by 6 points, while the Nasdaq Composite and the S&P posted modest advances, up by 2 and 1 point respectively to 6,075.34 and 2,389.52. Within the DJIA, United Health Group closed the day 0.92%, leading winners list, followed by 3M that added 0.82%. Caterpillar was the worst performer, down by 2.14%, followed by Chevron ad Exxon Mobil, both lower on plunging oil prices. From a technical point of view, the Dow maintains the neutral-to-bullish stance seen on previous updates, although with the downward potential limited, given that in the daily chart, the index presents another doji above all of its moving averages, whilst technical indicators keep consolidating well above their mid-lines, but with no certain directional stance. In the 4 hours chart, the index closed the day around a horizontal 20 SMA, while technical indicators turned flat around their mid-lines, erasing an early intraday spike and still failing to provide directional clues.
Support levels: 20,896 20,845 20,790
Resistance levels: 20,952 21,013 21,071
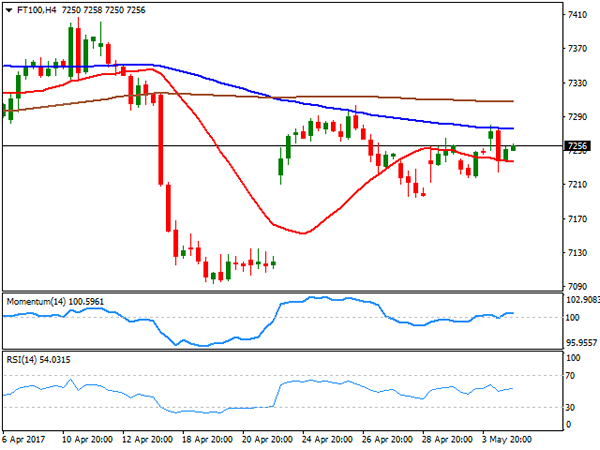
FTSE100
The FTSE 100 posted a modest advance this Thursday, adding 12 points or 0.19% to close at 7,248.10. A strong Pound offset positive earnings reports, limiting gains in local shares. Among major movers was HSBC that reported a 19% fall in first-quarter profits, less than market’s forecast, with shares ending 2.88% higher. International Consolidate Airlines Group led advancers with a 2.97% gain, while fashion retailer Next was the worst performer, down by 5.1% after reporting falling sales and trimming the top end of its full-year profit forecast. Mining-related equities were under pressure, with Antofagasta shedding 4.69% and Anglo American down by 4.69%. The daily chart shows that the benchmark settled around a bearish 20 SMA, whilst technical indicators remain within bearish territory and lean modestly towards the downside, limiting chances of a steeper recovery. In the 4 hours chart, the technical outlook for the index is neutral, given that its currently developing between flat 20 and 100 SMAs, whilst technical indicators aim marginally higher within neutral territory, in line with the longer term perspective.
Support levels:7,215 7,173 7,126
Resistance levels: 7,303 7,340 7,384
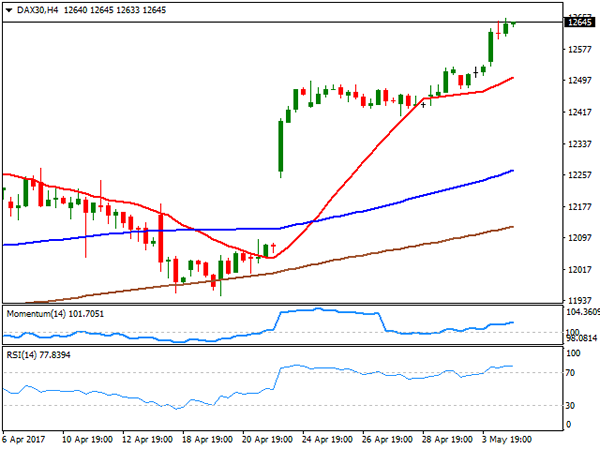
DAX
The German DAX reached an all-time high this Thursday, ending the day 121 points higher at 12,647.78, backed by strong earnings reports all through the region, and a continued improvement in market’s mood ahead of the final round of French presidential election next Sunday. Within the German benchmark, Commerzbank was the best performer, adding 2.83%, followed by Deutsche Post that closed 1.98% higher. Only five members closed down, led by Infineon Technologies that shed 2.18%. The daily chart for the benchmark supports a continued advance as technical indicators resumed their advances, with the RSI currently at 73 and moving averages gaining upward strength far below the current level. In the shorter term, and according to the 4 hours chart, the technical picture is also bullish, with technical indicators slowly regaining the upside after a period of consolidation within overbought readings.
Support levels: 12,629 12,583 12,530
Resistance levels: 12,656 12,690 12,730