Market Wrap
The markets have seen a mixture of bearish and bullish sentiments. Moreover, the dollar has been unfortunate to taste weakness in recent sessions as commodities and neighboring currencies have taken advantage of this. Gold has seen good strength as the greenback declines due to trade disputes. In the oil markets, it seems that supply is becoming more and more of a major concern as the sanctions placed on Iran approach. This in turn has reduced demand for oil which has forced the prices to decline for both Brent crude and West Texas Intermediate. In addition, indexes seem to have had a variety of highs and lows, as the recent events in tech stocks had shown declines. Nevertheless, it seems that Dow Jones is on the rise with a bullish momentum.
EURUSD
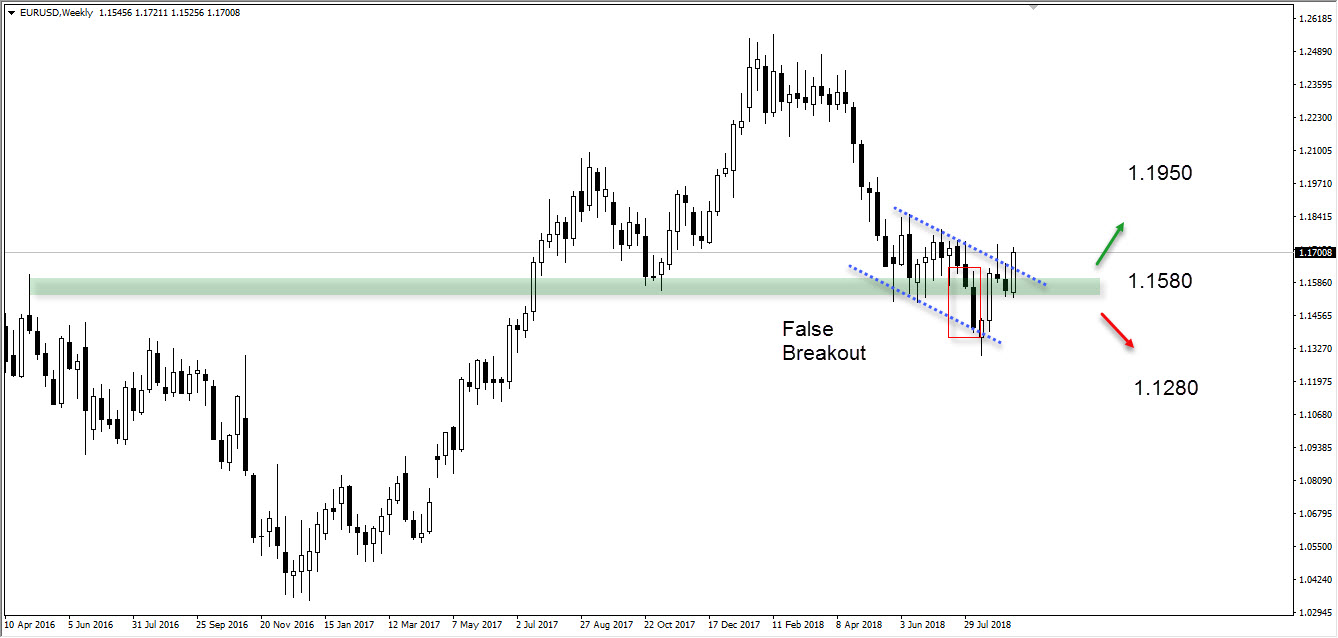
The chart below on a weekly time-frame shows the pair EUR/USD trading in a downward channel where the price had initially experienced a rebound and in result of this the price had continued to rise, which led to a close above the major level $1.1580. Moreover, it is also displayed below that the previous bearish breakout had failed. If the price continues to rise it may trade towards resistance zone (indicated by green arrow) which is priced at $1.1950.
On the other hand, if the price declines and breaks out of the downward channel then the pair in this case may travel towards the support zone (indicated by red arrow) which is priced at $1.1280.
Major support: 1.1280
Major resistance: 1.1950
GBPUSD
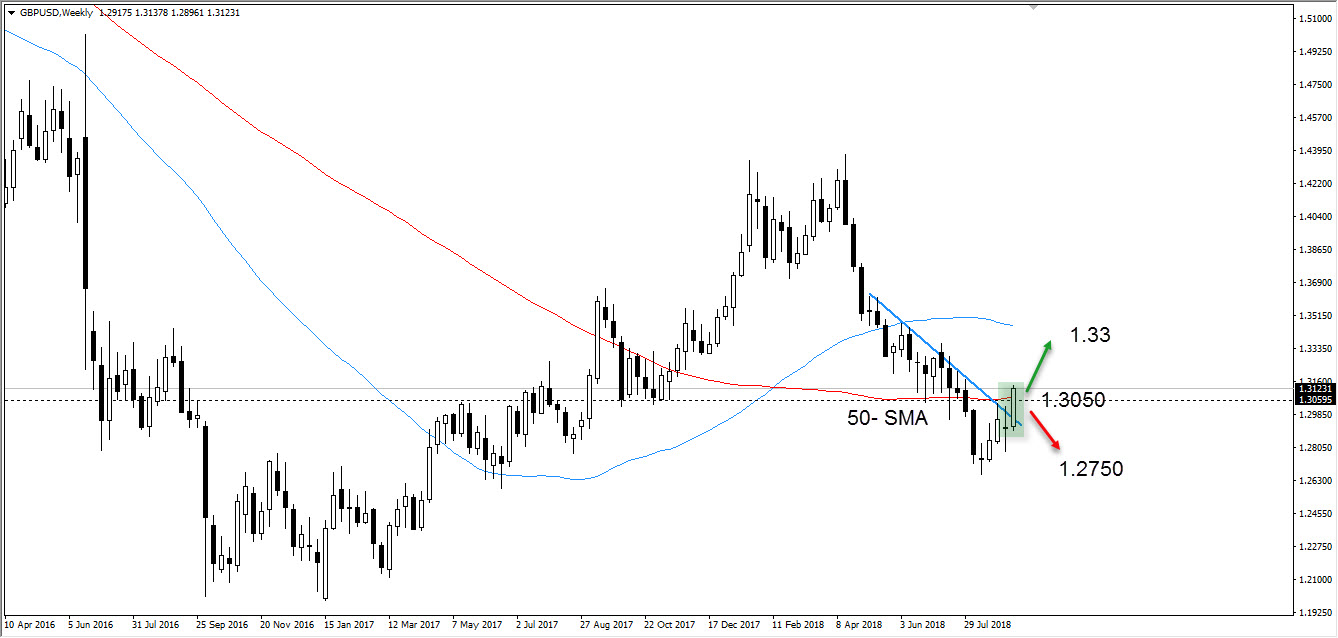
The chart below on a weekly time-frame shows the pair GBP/USD trading in an uptrend where the weekly close has finished above the 50-day moving average. This is a bullish sign which may continue to drive the price higher. Moreover, the strong buying momentum remains where the weak U.S. dollar is liable to this.
In addition, the price at present is controlled by the bulls. Therefore, if this carries on it may allow the pair to trade in the direction of the resistance zone (indicated by green arrow) which is priced at $1.33. Nevertheless, if by chance the bullish momentum dies out and bears gain the upper hand, then this may provoke the price to trade towards the support zone (indicated by red arrow) which is priced at $1.2750.
Major support: 1.2750
Major resistance: 1.33
USDJPY
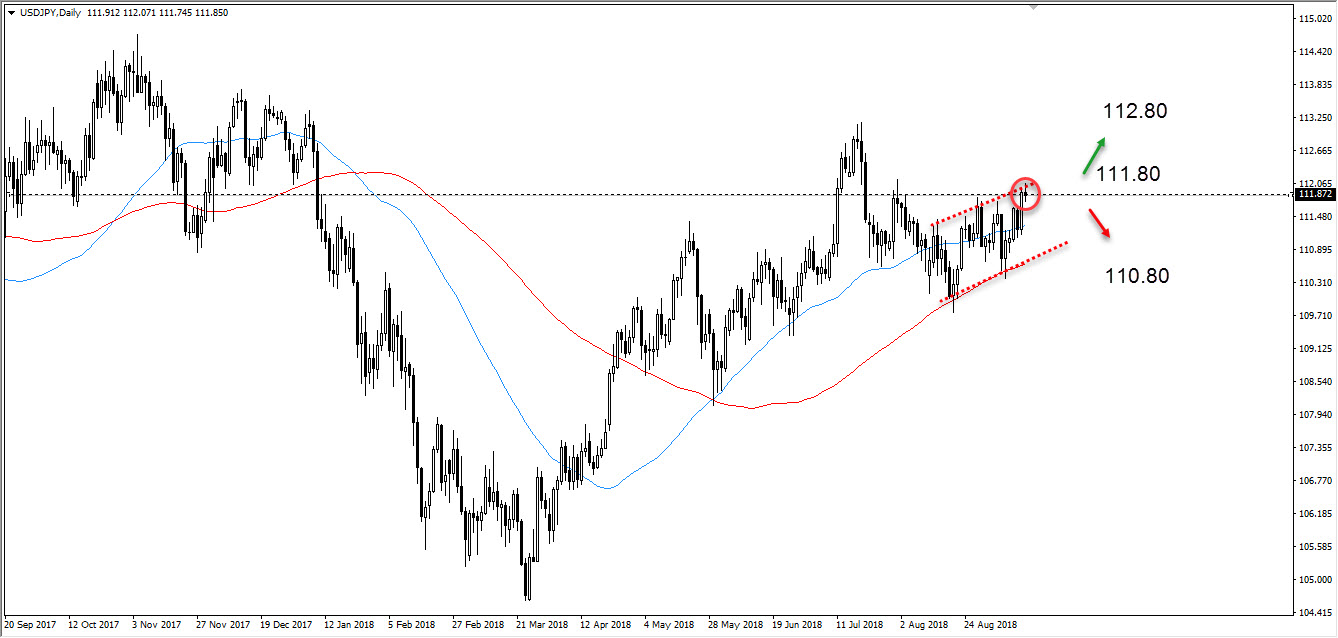
The chart below on a daily time-frame shows the pair USD/JPY presently trading in an upward cannel, where the price is currently at $111.87. Moreover, it is displayed that the price had failed to break above the resistance zone (indicated by green arrow) which is priced at $112.80. Additionally, this is in the same region as the upper line of the upward channel. This has prevented the price from increasing like the previous candle shown at resistance zone.
As long as the markets continue to trade below $111.80 there maybe a strong downward move where the price could approach the down line of the upward channel and support zone (indicated by red arrow) which is priced at $110.80.
Major support: 110.80
Major resistance: 112.80
Gold
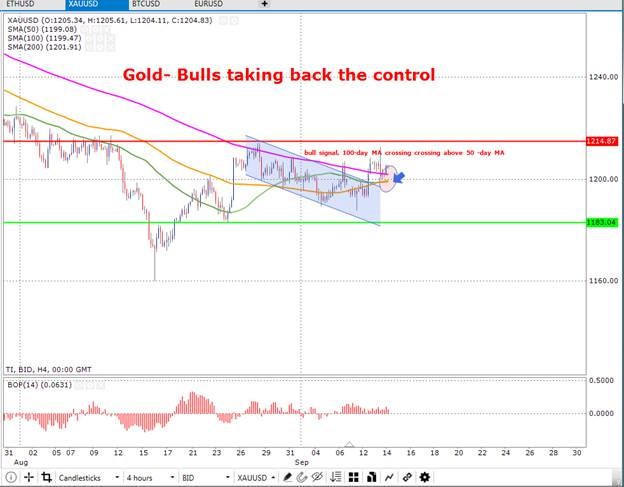
The chart below on an intra-day time frame (4 hours) shows gold trading in an uptrend. Moreover, the price is currently trading above all moving averages where additionally, it is displayed below that the 100-day moving average seems to be performing a cross over above the 50-day moving average which lets off a strong bullish signal. In result, this may allow the price to continue trading towards the resistance zone (colored in red) which is priced at $1214.87. On the other hand, if the price starts to decline where the bears take over, then the price may move in the direction of the support zone (shown in horizontal green line) which is priced at $1183.04.
The Balance of Power chart below confirms the bullish momentum which is present in the markets for gold. However, the chart shows a variety of highs and lows, but at present the price looks to be in bull territory. Nevertheless, this is not to say this will always be the case.
Major support: 1183.04
Major resistance: 1214.87
Oil
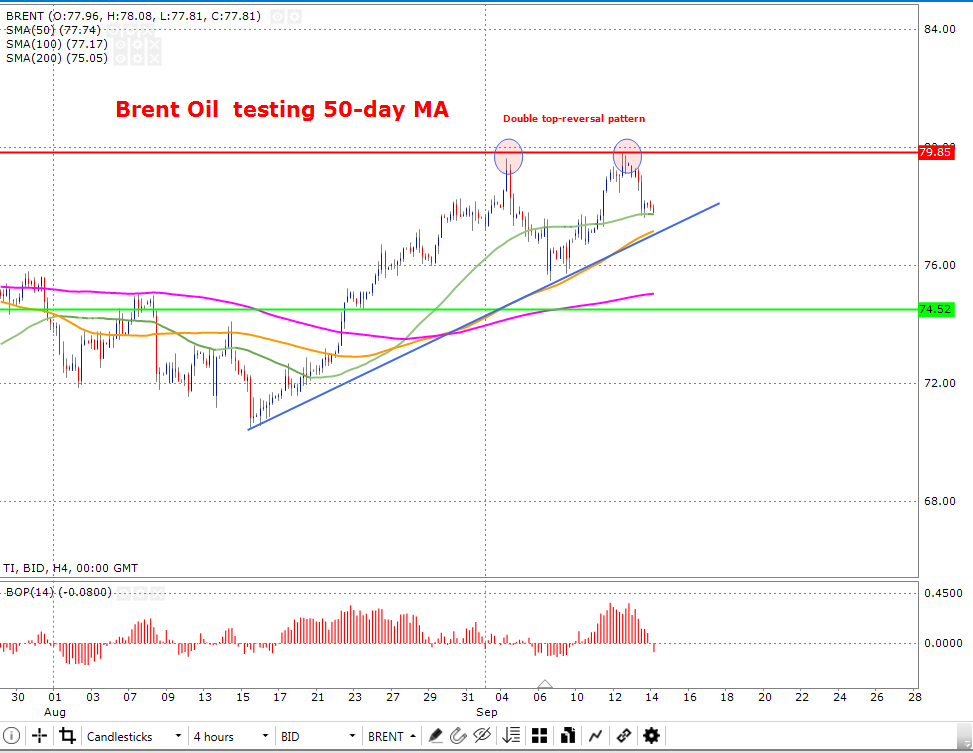
The chart below on an intra-day time frame (4 hours) shows Brent crude oil trading in an uptrend where the price is testing the 50-day (colored in green) moving average. It is displayed that the price had encountered two double top reversal patterns which is clearly displayed in the chart as transparent circles. Moreover, this is most commonly known as a reversal pattern which informs a potential correction.
If the price experiences an increase in price, then oil may trade towards the resistance zone (shown in horizontal red line) which is priced at $79.85. In addition, this is where the two-previous double top reversal patters had taken place. On the other hand, if the price declines where a bearish momentum would be present, then the price may trade towards the support zone (shown in horizontal green line) which is priced at $74.52.
The Balance of Power chart below shows that the bears have gained strength and are currently in control. Nevertheless, it is also displayed that the bulls had a long win streak. However, dependent upon the outcome of the price testing the 50-day moving average shown below may determine which side of the markets will hold dominance.
Major support: 74.52
Major resistance: 79.85
Dow Jones
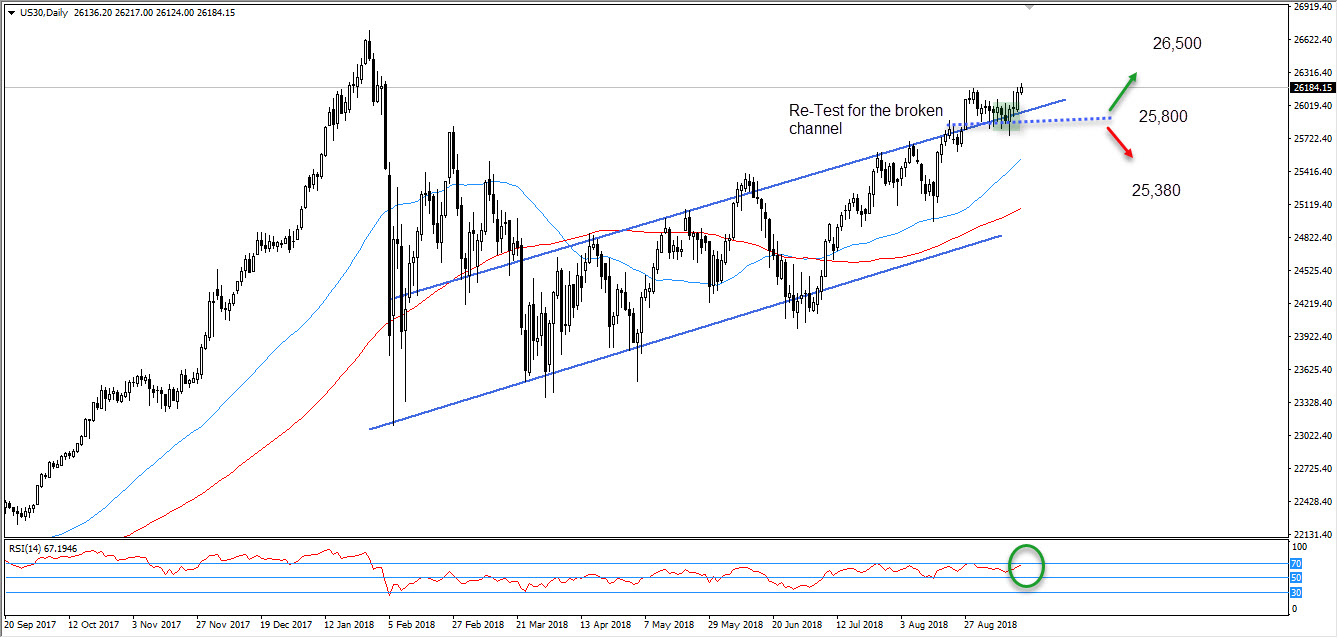
The chart below on a daily time-frame shows the index Dow Jones currently trading at $26184.15. Moreover, it is displayed that buying interest had increased as the Index experienced a re-test at the upper line of the upward channel where the support zone also stands (dotted blue line) which is priced at $25,800.
It is displayed below that a strong buying momentum is present in the markets and if this persists, then the index may see increases in the direction of the major resistance zone (indicated by green arrow) which is priced at $26.500. However, this is if the price continues to trade above $25,800. If the prices fail to do so, it may trade towards support zone (indicated by red arrow) which is priced at $25,380.
The Relative Strength Index chart shows that the price is heavily in the over sold territory. Therefore, a bearish sentiment maybe among the markets in the upcoming sessions. However, this is only a possibility.
Major support: 25,380
Major resistance: 26,500