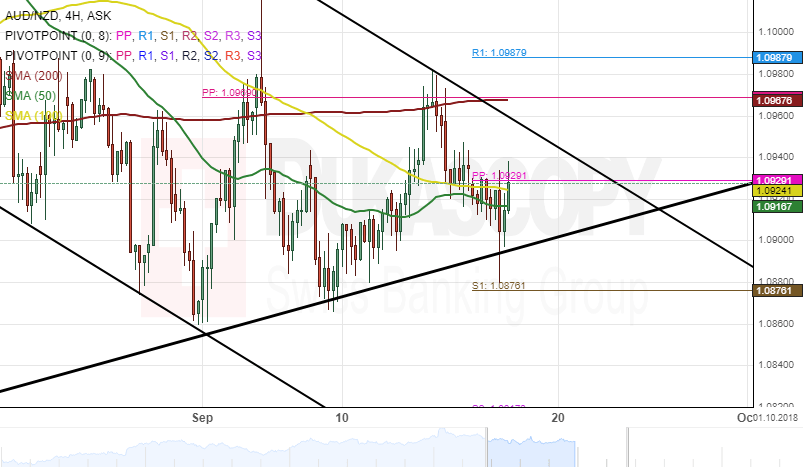
The AUD/NZD currency pair has been moving in a descending channel during the past one month. During this period, the exchange rate tested the lower boundary of a dominant ascending channel.
Presently, the rate is trading near the bottom border of the dominant channel pattern and could be set for a breakout.
Technical indicators favour bullish signals on the weekly time-frame, therefore, a reversal from the border as mentioned above at 1.0900 could be a possibility during the following trading sessions. Bullish traders could push the rate towards the 200-hour SMA at 1.0967 within this week.