
The EUR/USD currency pair
Technical indicators of the currency pair:
Prev Open: 1.14265
Open: 1.14256
% chg. over the last day: +0.05
Day’s range: 1.14119 – 1.14366
52 wk range: 1.1299 – 1.2557
Yesterday, the trends on the EUR/USD were highly ambiguous. At the moment, the quotes are consolidating. The local support and resistance levels are 1.14200 and 1.14500 respectively. Positions should be opened from these levels. The market participants are waiting for the Federal Reserve decision regarding the key interest rate.
At 21:00 (GMT+2:00) the Federal Reserve will determine the key interest rate.
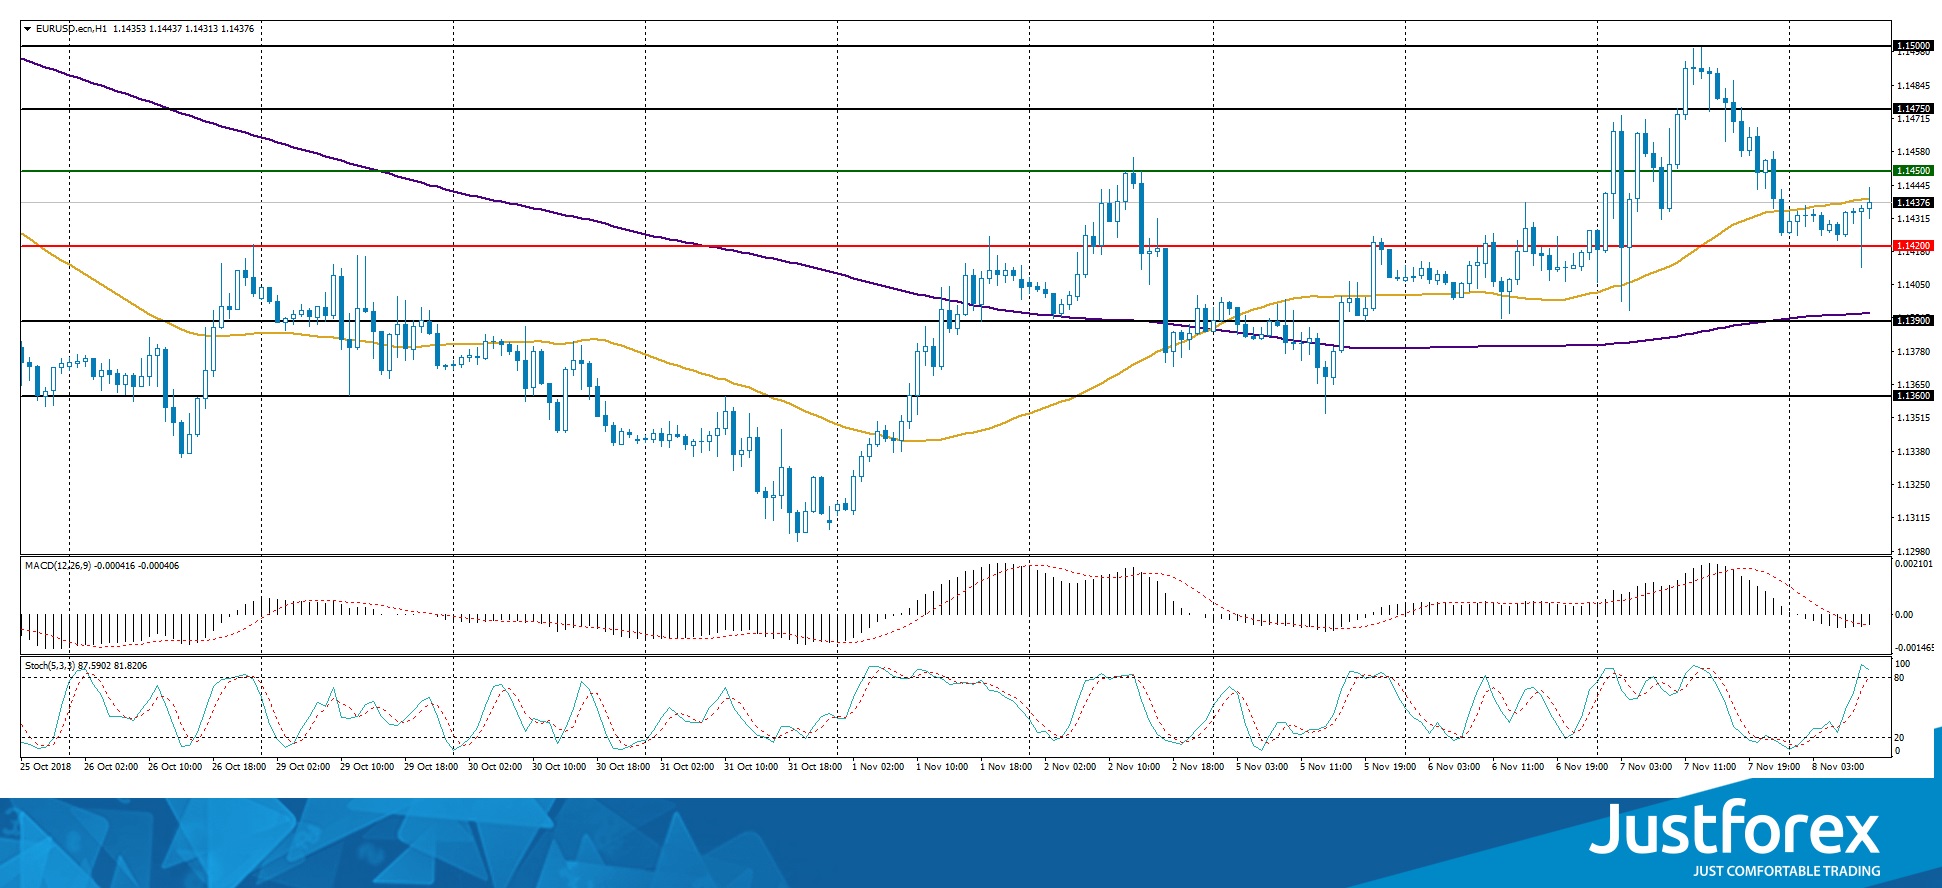
Indicators do not provide precise signals, the price is trending between 50 MA and 200 MA.
The MACD histogram is in the negative and below the signal line, which provides a strong signal towards the purchase of EUR/USD.
The Stochastic Oscillator is near the overbought zone, the %K line crosses the %D line. There are no signals at the moment.
Trading recommendations
Support levels: 1.14200, 1.13900, 1.13600
Resistance levels: 1.14500, 1.14750, 1.15000
If the price holds above the resistance level 1.14500, we can expect further growth. The movement will tend toward 1.15000-1.15250.
Alternatively, the price fixes below 1.14200, and you should look for the market entry points to open the short positions. The movement will tend toward 1.13750-1.13500.
The GBP/USD currency pair
Technical indicators of the currency pair:
Prev Open: 1.29981
Open: 1.31227
% chg. over the last day: +0.22
Day’s range: 1.31366 – 1.31440
52 wk range: 1.2662 – 1.4378
GBP/USD is showing an ambiguous technical picture. The GBP is trading in flat. The key support and resistance levels are 1.31000 and 1.31600, respectively. The GBP/USD quotes have a potential for further growth. We recommend you watch out for the relevant data regarding Brexit.
The Economic News Feed for Great Britain is calm.
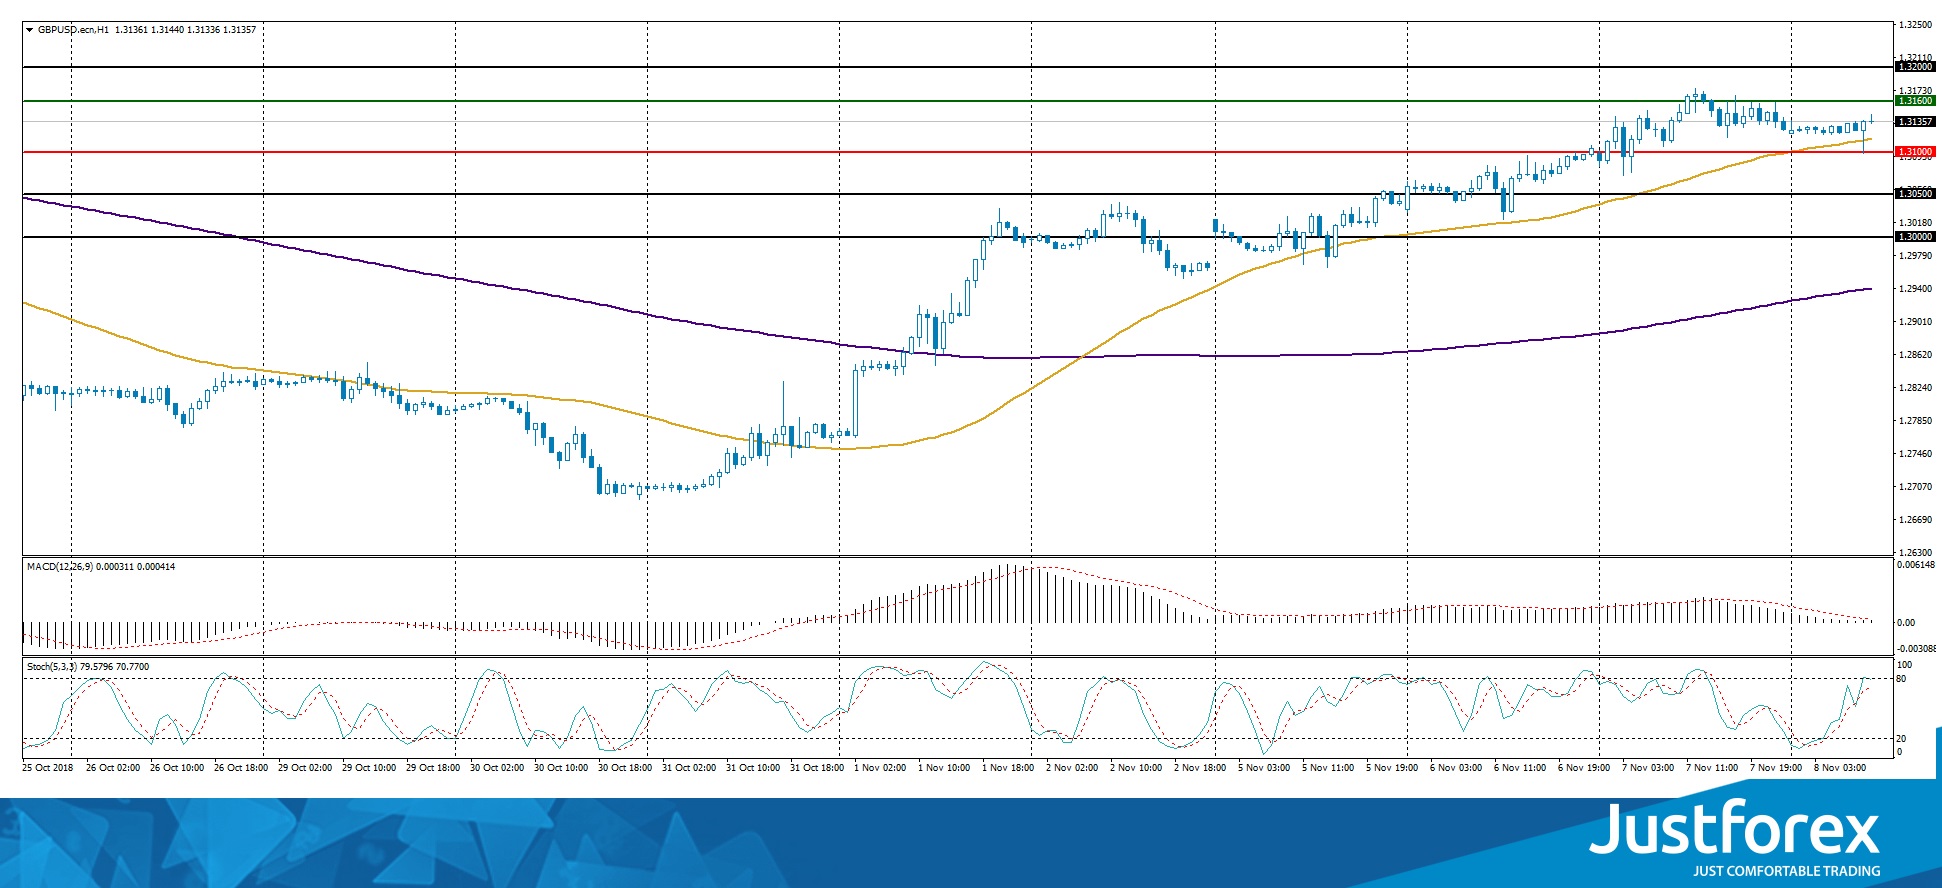
The indicators do not provide precise signals, the price is testing 50 MA.
The MACD histogram is near 0.
The Stochastic Oscillator is around the overbought zone, the %K line is above the %D line, which provides a weak signal for purchase.
Trading recommendations
Support levels: 1.31000, 1.30500, 1.30000
Resistance levels: 1.31600, 1.32000
If the price fixes above the resistance level 1.31600, we can expect further growth. The movement will tend toward 1.32000-1.32200.
Alternatively, the GBP/USD quotes can fall to 1.30500-1.30200.
The USD/CAD currency pair
Technical indicators of the currency pair:
Prev Open: 1.31209
Open: 1.31130
% chg. over the last day: -0.05
Day’s range: 1.30989 – 1.31059
52 wk range: 1.2248 – 1.3387
The USD/CAD currency pair is showing a variety of trends. Yesterday, Ivey published the Purchasing Managers’ Index for October in Canada, which reached 61.8 instead of the expected 50.9. The key support and resistance levels are 1.30900 и 1.31300, respectively. Positions should be opened from these levels. We recommend you keep an eye on the oil quotes.
The Economic News Feed for Canada is calm.
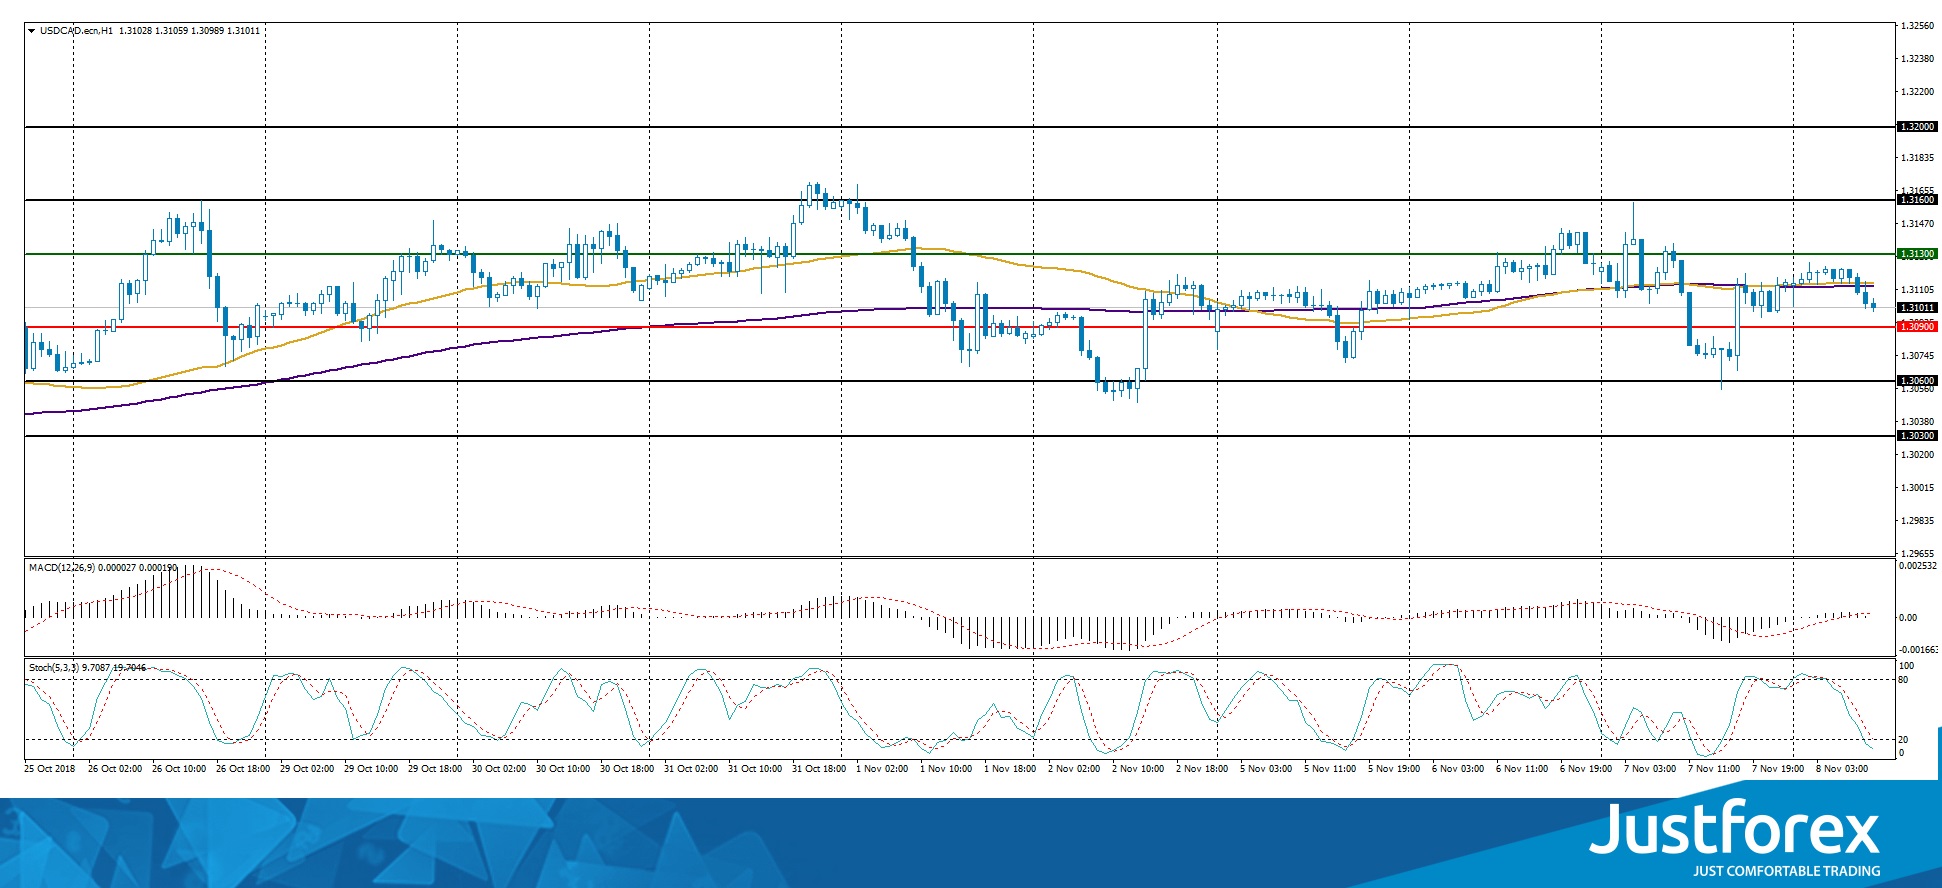
The indicators do not provide precise signals: 50 МА is over 200 МА.
The MACD histogram is near 0.
The Stochastic Oscillator is near the overbought zone, the %K line is below the %D line, which indicates a bearish sentiment.
Trading recommendations
Support levels: 1.30900, 1.30600, 1.30300
Resistance levels: 1.31300, 1.31600, 1.32000
If the price fixes above 1.30900, we recommend you to sell USD/CAD. The movement will tend toward 1.30600-1.30300.
Alternatively, the currency pair can grow towards 1.31600-1.31800.
The USD/JPY currency pair
Technical indicators of the currency pair:
Prev Open: 113.400
Open: 113.400
% chg. over the last day: +0.11
Day’s range: 112.947 – 113.102
52 wk range: 104.56 – 114.74
The USD/JPY is showing a bullish sentiment. During today’s and yesterday’s trading, the quotes have updated the local maximums. The local support and resistance levels are 113.500 and 113.800 respectively. Positions should be opened from these levels. The USD/JPY quotes have prospects for further growth. We recommend you keep an eye on the 10-year US government bonds yield.
The Economic News Feed for Japan is calm.
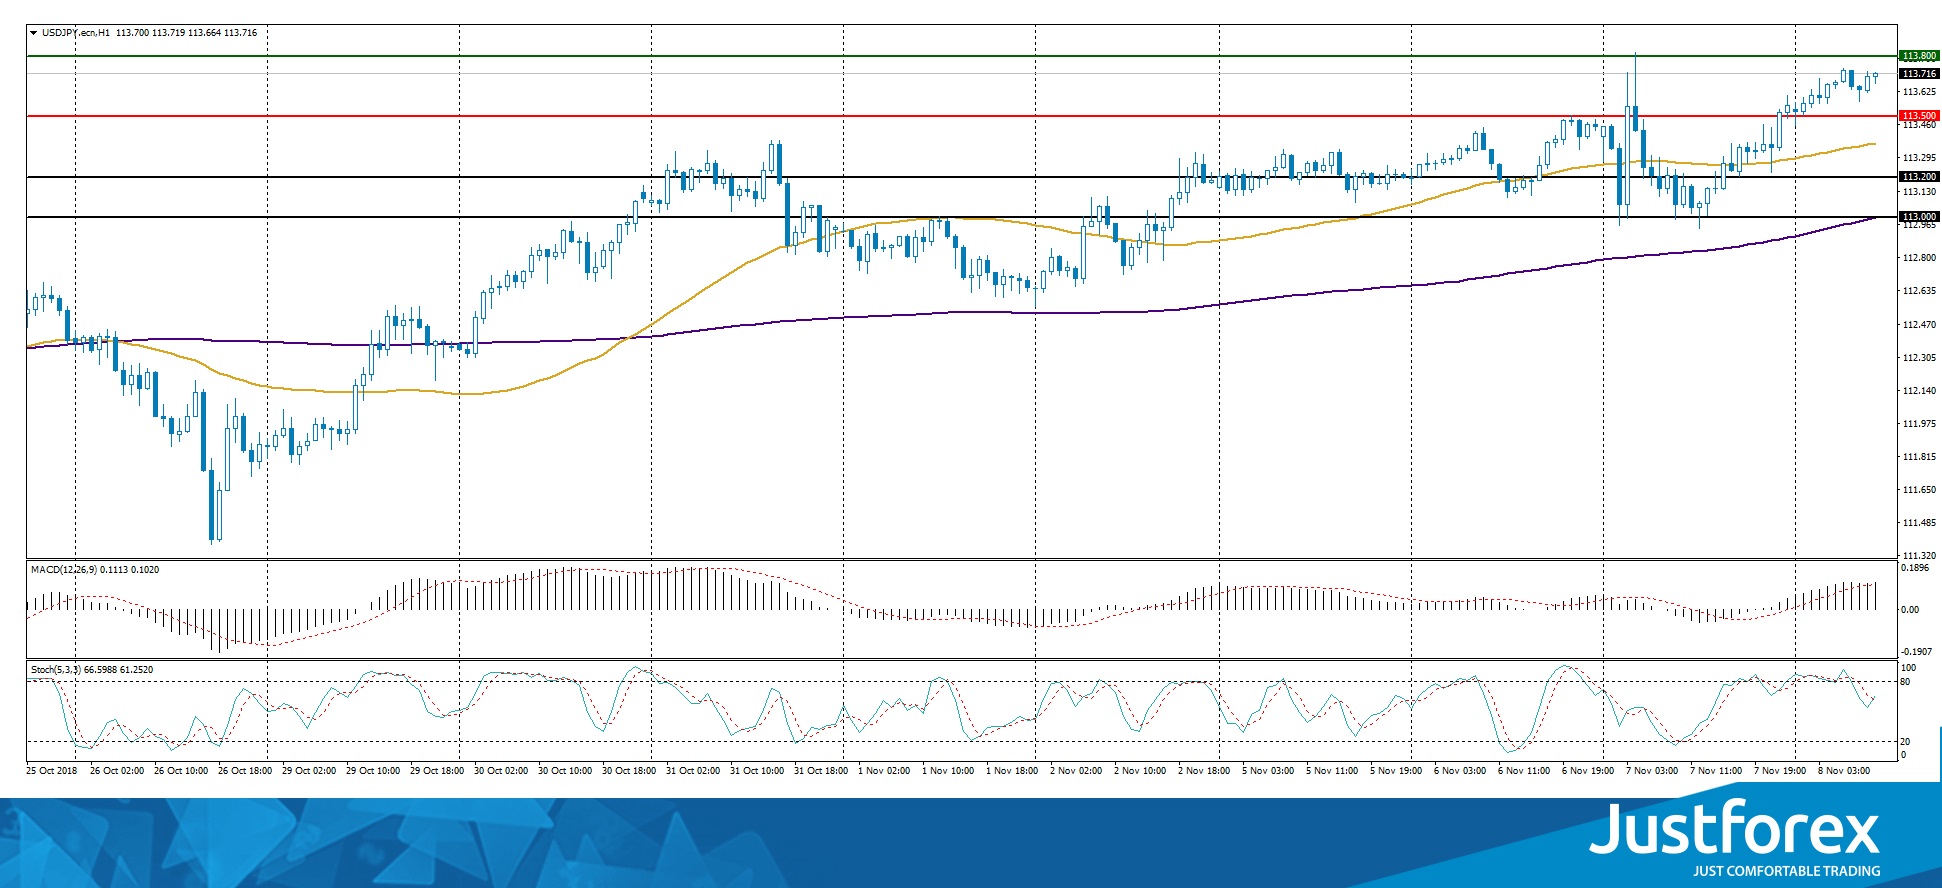
The indicators show the buyers’ power: the price is trading above the 50 MA and 200 MA.
The MACD histogram is in the positive zone and above the signal line, which provides a strong signal toward the purchase of USD/JPY.
The Stochastic Oscillator is in the neutral zone, the %L line crosses the %D line. There are no price signals.
Trading recommendations
Support levels: 113.500, 113.200, 113.000
Resistance levels: 113.800, 114.000, 114.500
If the price fixes below the support 113.500, we should expect the descend. The movement will tend toward 113.000. Alternatively, the currency pair can grow toward 114.200-114.500.


