
The EUR/USD currency pair
Technical indicators of the currency pair:
Prev Open: 1.12864
Open: 1.13678
% chg. over the last day: +0.71
Day’s range: 1.13824 – 1.13975
52 wk range: 1.1299 – 1.2557
Yesterday, EUR/USD was showing aggressive purchases. USD is weakened against the EUR after the release of the weak economic stats and statements by the head of the Federal Reserve. EUR/USD quotes grew by more than 100 points. At the moment, the local support and resistance levels are 1.13700 and 1.14000. Positions should be opened from these levels. Quotes have a tendency to grow further.
The news feed on 29.11.2018:
Unemployment Change in Germany (EU) – 10:55 (GMT+2:00);
Pending Home Sales (US) – 17:00 (GMT+2:00);
FOMC Minutes Release (US) – 21:00 (GMT+2:00).
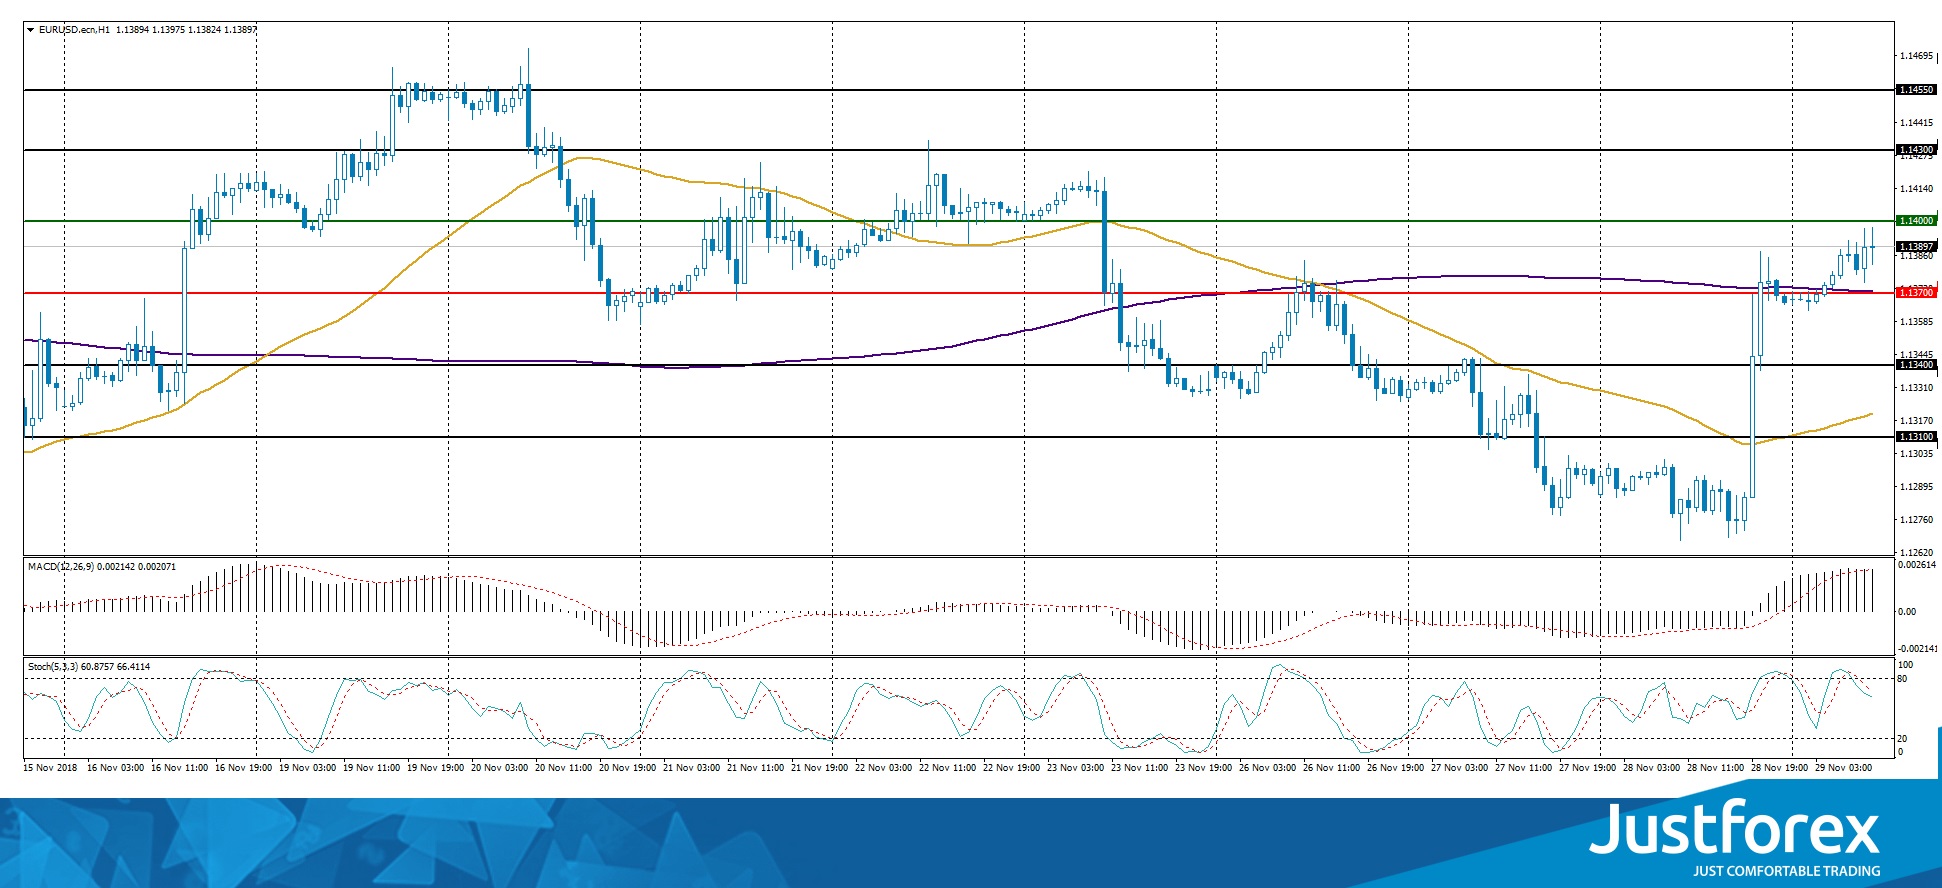
Indicators point to the power of buyers: the price has fixed above 50 MA and 200 MA.
The MACD histogram is in the positive zone but below the signal line, which gives a weak signal to sell EUR/USD.
Stochastic Oscillator is in the neutral zone, the %K line is below the %D line, which indicates the bearish sentiment.
Trading recommendations
Support levels: 1.13700, 1.13400, 1.13100
Resistance levels: 1.14000, 1.14300, 1.14550
If the price fixes above 1.14000, the EUR/USD quotes can grow further. The movement is tending to 1.14300-1.14550.
Alternatively, the EUR/USD can fall toward 1.13400-1.13100.
The GBP/USD currency pair
Technical indicators of the currency pair:
Prev Open: 1.27415
Open: 1.28235
% chg. over the last day: +0.56
Day’s range: 1.27790 – 1.28345
52 wk range: 1.2662 – 1.4378
Yesterday, GBP/USD market was in a bullish mood. The quotes have grown by 80 points. Currently the quotes are descending and testing the 1.27750 support. The resistance is at 1.28300. Positions should be opened from the key levels, the quotes can descend further.
Today we do not expect any publication of important economic reports from the UK.
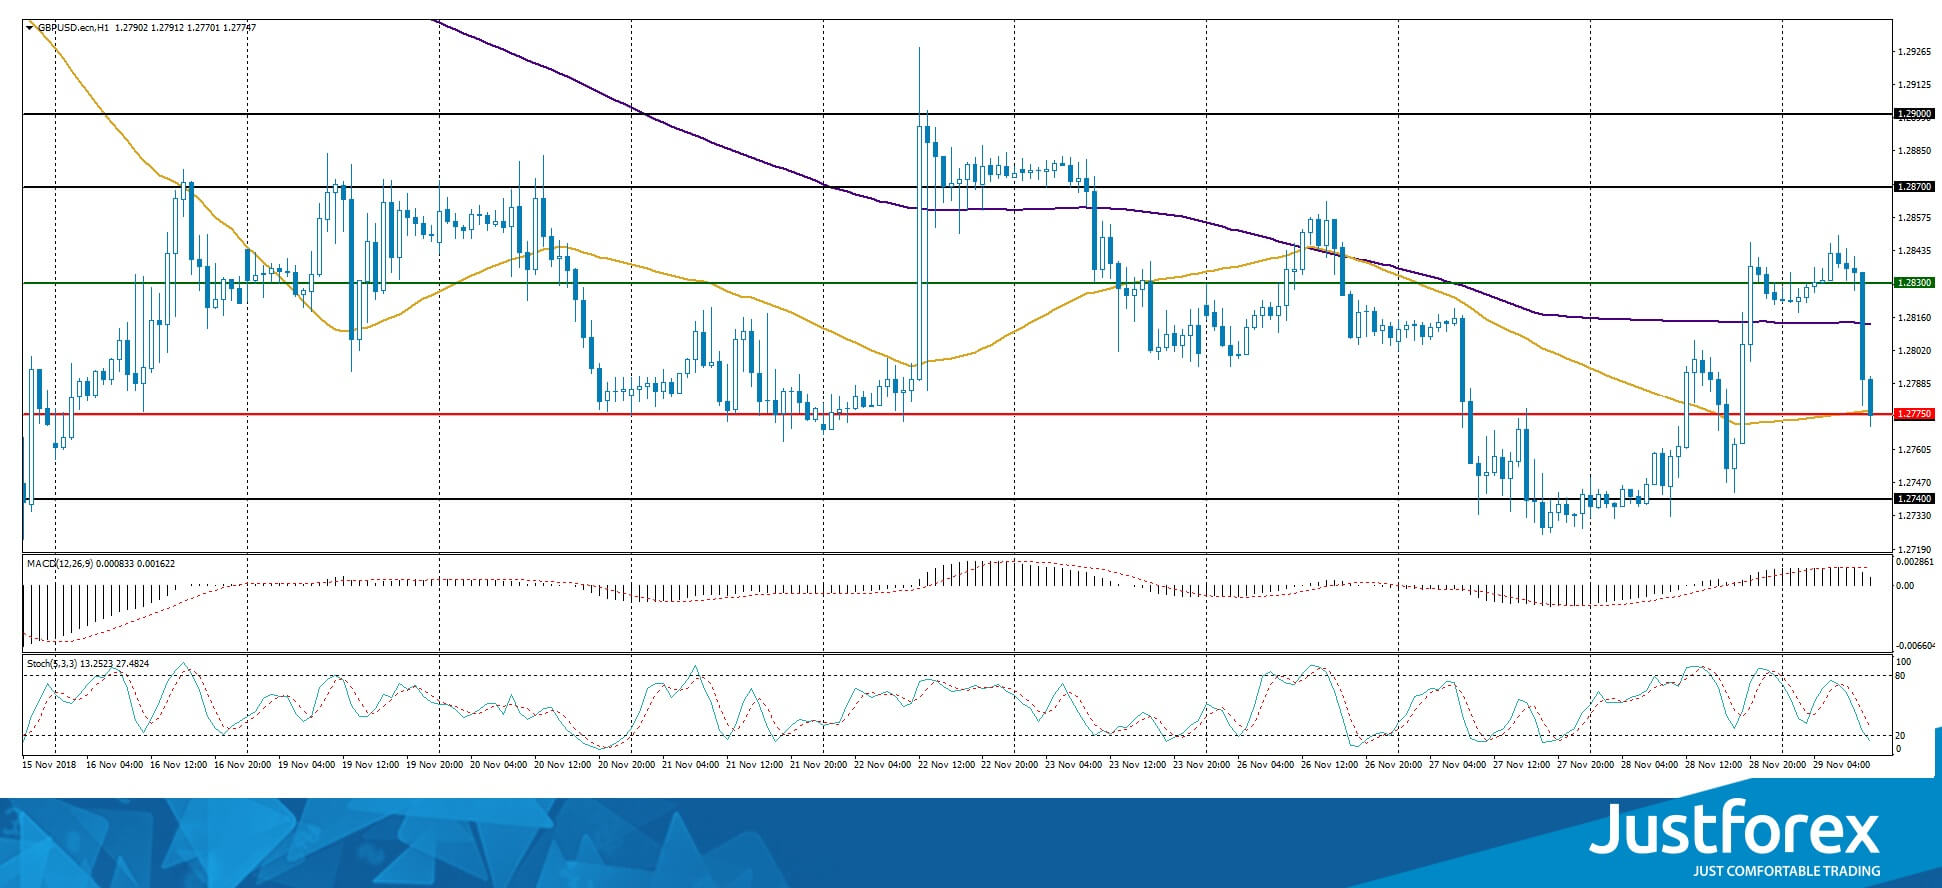
Indicators do not provide precise signals: the price is being traded between 50 MA and 200 MA.
The MACD histogram is in the positive zone, but below the signal line, which gives a weak signal to buy GBP/USD.
Stochastic Oscillator is in the neutral zone, the %K line has is below the %D line, which indicates a bearish sentiment.
Trading recommendations
Support levels: 1.27750, 1.27400
Resistance levels: 1.28300, 1.28700, 1.29000
If the price fixes below the mirror support level of 1.27750, a further drop in the GBP/USD quotes is expected. The movement is tending to 1.27400-1.27000.
Alternatively, GBP/USD can correct to the round level of 1.28300-1.28500.
The USD/CAD currency pair
Technical indicators of the currency pair:
Prev Open: 1.32922
Open: 1.32725
% chg. over the last day: -0.14
Day’s range: 1.32533 – 1.32723
52 wk range: 1.2248 – 1.3387
Yesterday the USD/CAD market was in a bearish mood. At the moment the picture is ambiguous. The quotes are moving sideways. The local support and resistance are 1.32500 and 1.32850. Positions should be opened from these levels. Also, keep an eye on the oil quotes` dynamic.
The news feed on the economy of Canada is calm.
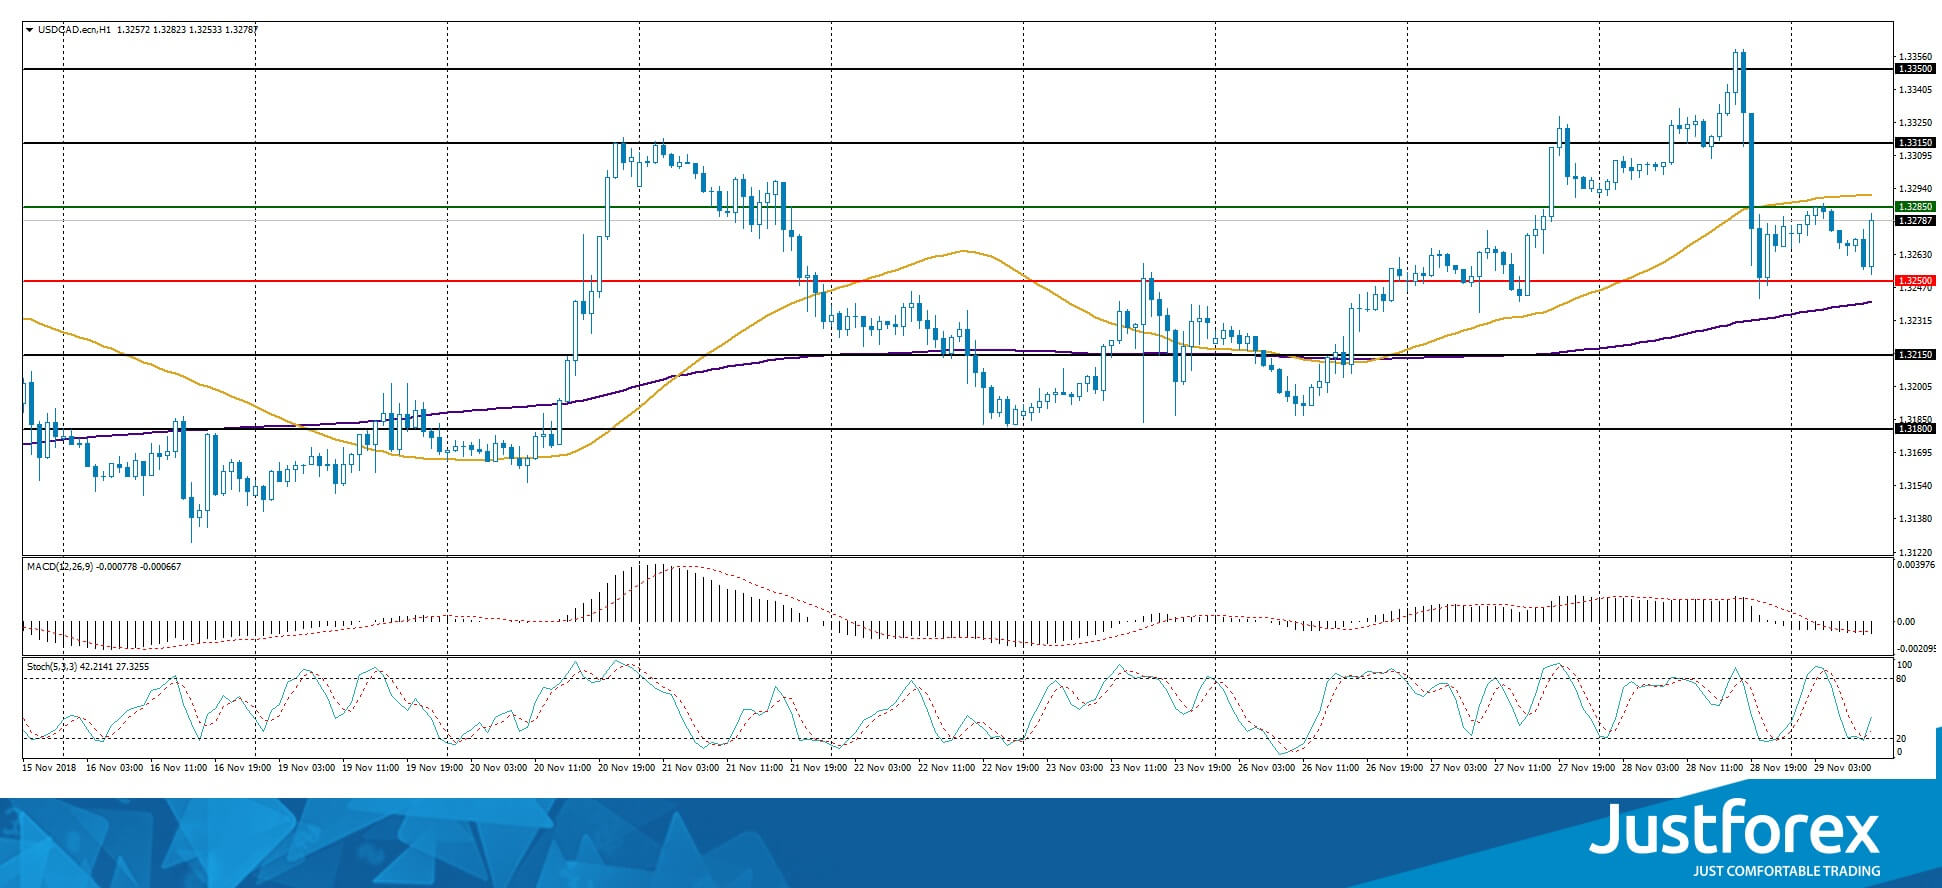
Indicators do not provide precise signals, the price is being traded between 50 MA and 200 MA.
The MACD histogram is in the negative zone, below the signal line, which gives a strong signal to sell USD/CAD.
The Stochastic Oscillator is in the neutral zone, the %K line is above the %D line, which indicates a bullish sentiment.
Trading recommendations
Support levels: 1.32500, 1.32150, 1.31800
Resistance levels: 1.32850, 1.33150, 1.33500
If the price fixes above the support level of 1.32500, you should consider selling USD/CAD. The movement is tending to 1.32150-1.31800.
Alternatively, the price fixes above 1.32850 and you should look for the market entry points to open long positions. The movement will tend toward 1.33150-1.33500.
The USD/JPY currency pair
Technical indicators of the currency pair:
Prev Open: 113.766
Open: 113.672
% chg. over the last day: -0.19
Day’s range: 113.327 – 113.375
52 wk range: 104.56 – 114.74
USD/JPY is in a downward trend. The local support and resistance are 113.200 and 113.450. The quotes can descend further. You should keep an eye on the 10-year yield of the US Treasury bonds.
Publication of important economic reports from Japan is not planned.
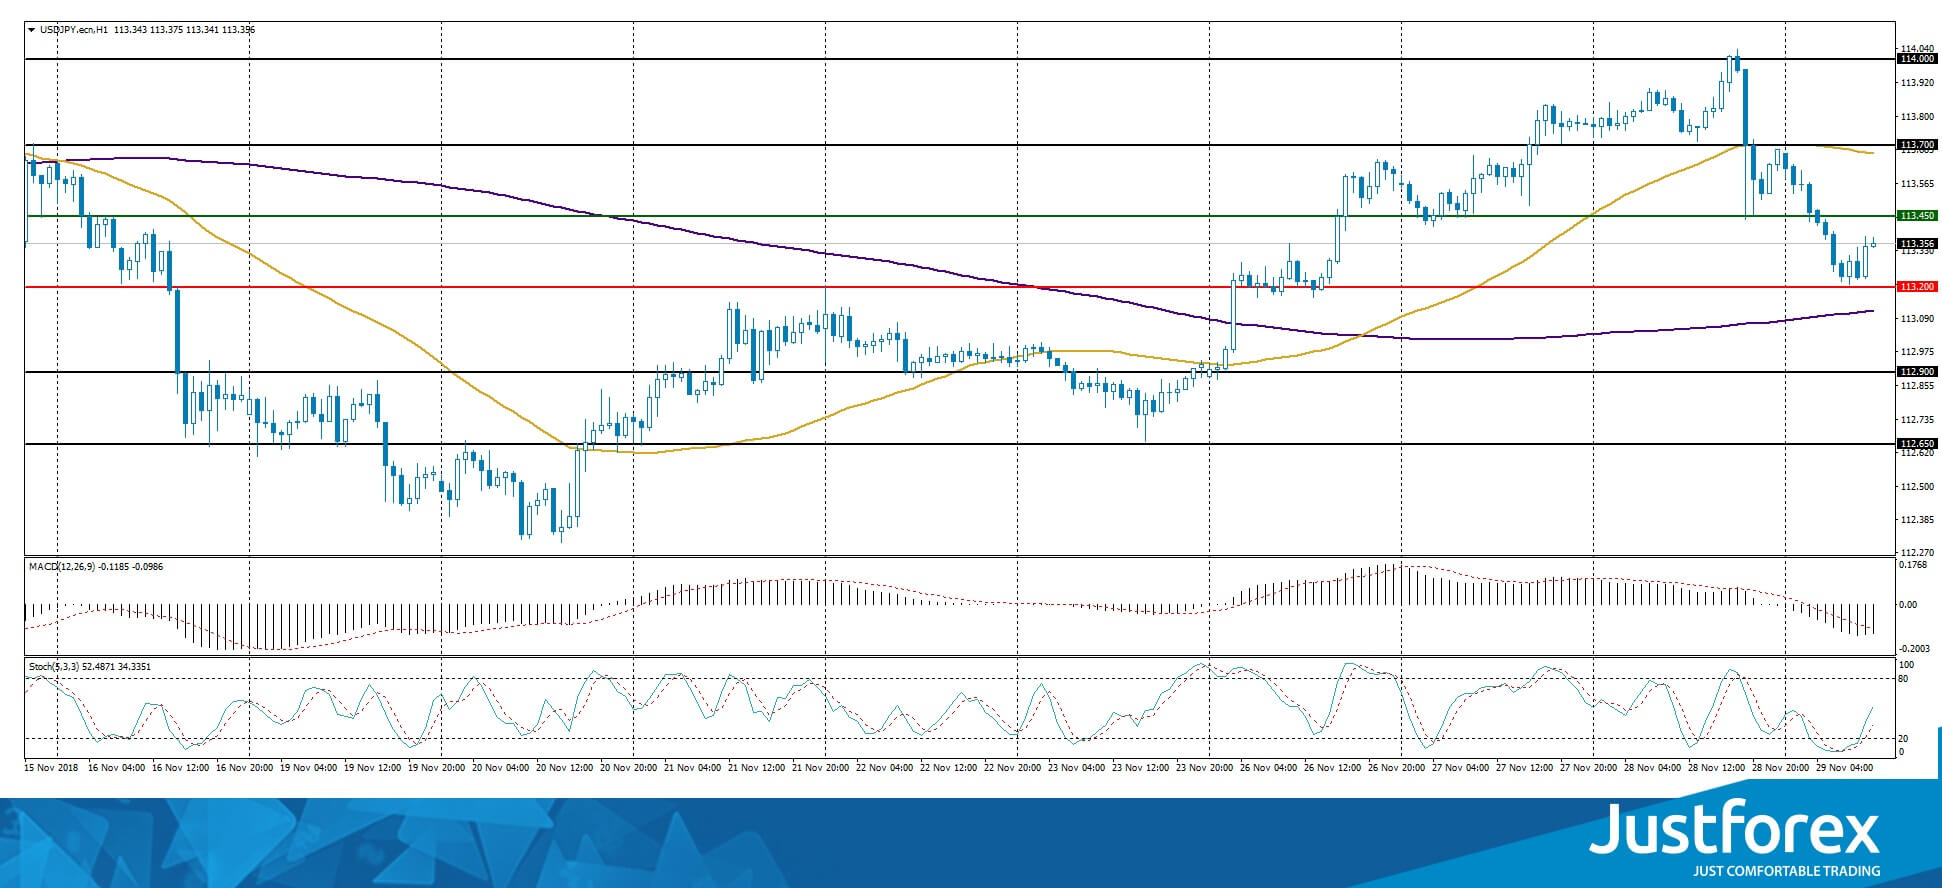
Indicators do not provide precise signals, the price has fixed between 50 MA and 200 MA.
The MACD histogram is in the negative zone, below the signal line, which gives a strong signal to sell USD/JPY.
Stochastic Oscillator is in the neutral zone, the %K line is above the %D line, which indicates the bullish sentiment.
Trading recommendations
Support levels: 113.200, 112.900, 112.650
Resistance levels: 113.450, 113.700, 114.000
If the price fixes below the local support of 113.200, further growth of the USD/JPY quotes is expected. The movement is tending to 112.900-112.650..
An alternative may be the USD/JPY currency pair growth to 113.700-114.000.


