Bulls are controlling the momentum
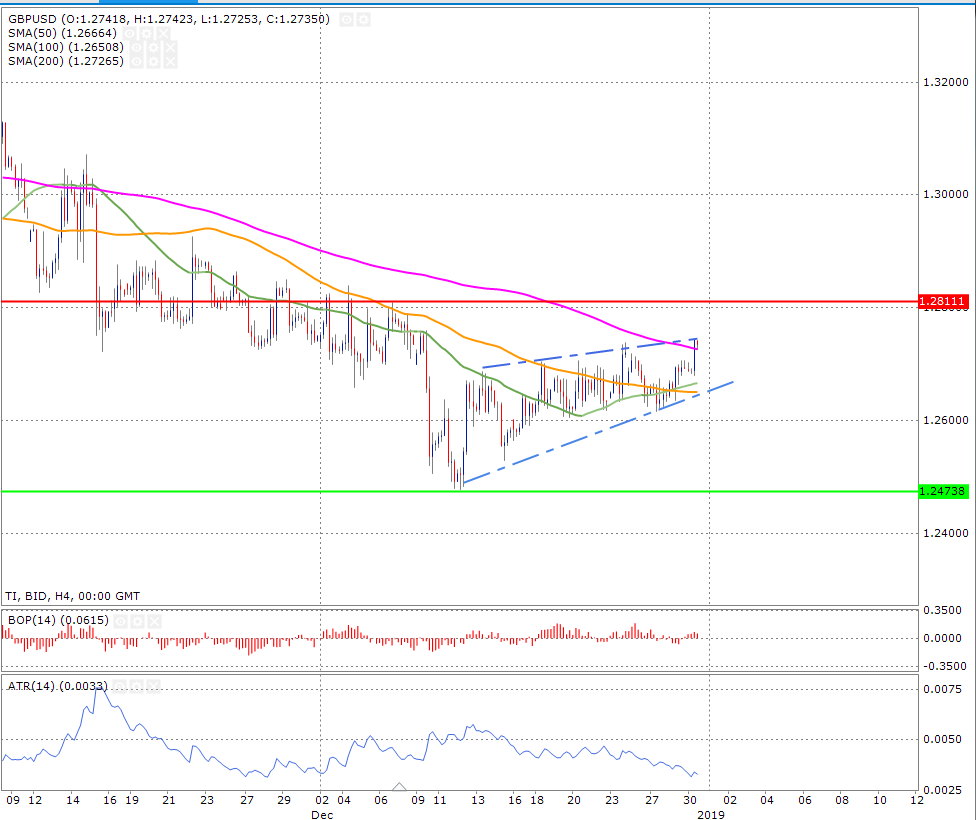
The GBP/USD pair is trading in uptrend on a 4-hour time frame. The confirmation of the uptrend comes from the fact that the price has broken its 50-day moving average (show in orange) and the 100-day moving average (shown in green). Moreover, the price has broken the 200-day moving average to the upside (shown in pink). This clearly shows that the momentum has shifted towards the bull and the are in control of the price.
The average true range indicator shows that there isn’t enough volatility for the pair and this isn’t really a surprise as most of the recent price action has been during the holiday season.
In terms of patterns, the price is trading in an upward wedge pattern, it has challenged the upward line of this wedge pattern and a break of this line would be very bullish.
- The support zone is shown by the green horizontal line
- The resistance zone is shown by the red horizontal line