
The EUR/USD currency pair
Technical indicators of the currency pair:
Prev Open: 1.13644
Open: 1.13597
% chg. over the last day: -0.02
Day’s range: 1.13616 – 1.13647
52 wk range: 1.1214 – 1.2557
EUR/USD is showing an ambiguous technical picture. The quotes are moving sideways. Yesterday the US published a weak report on the secondary real estate market, where the sales lowered to 4.99M instead of 5.25M. You should open positions from the key range of 1.13500-1.13750.
The Economic News Feed for 23.01.2019 is calm.
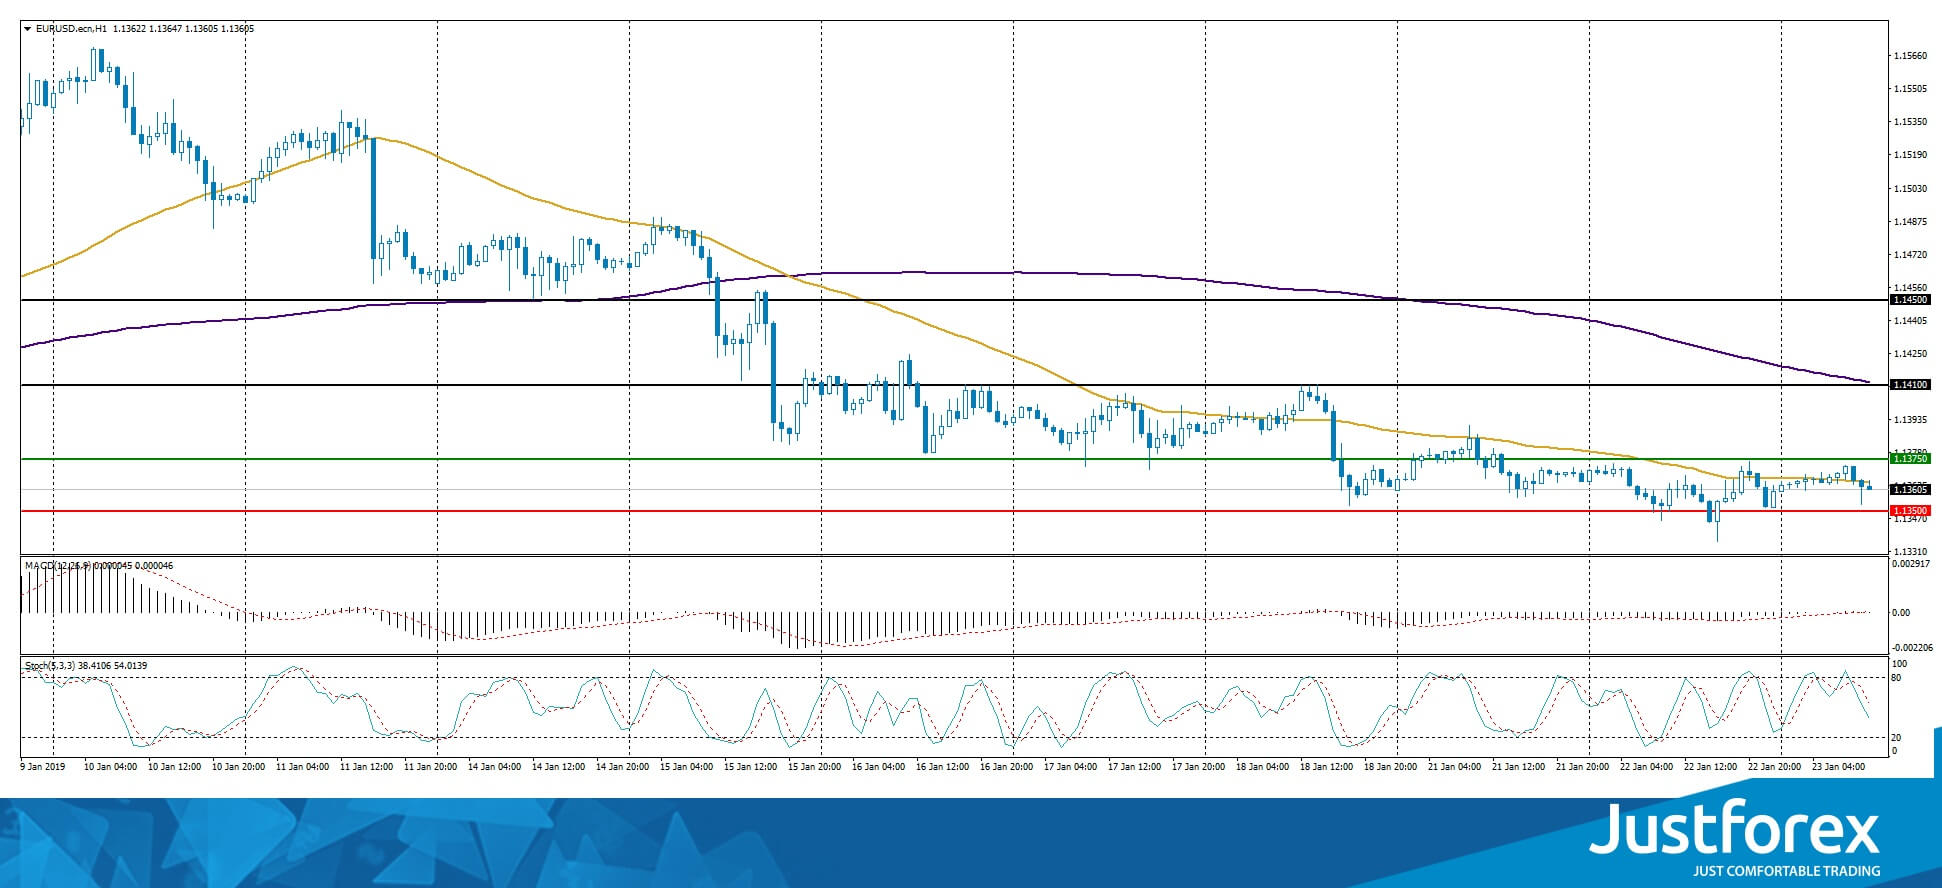
The indicators do not provide precise signals, the price is testing 50 MA.
The MACD histogram is close to 0.
The Stochastic Oscillator is in the neutral zone, the %K line is below the %d line which points to the bearish mood.
Trading recommendations
Support levels: 1.13500, 1.13150
Resistance levels: 1.13750, 1.14100, 1.14500
If the price fixes below 1.13500 consider selling EUR/USD. The movement will tend toward 1.13150-1.29990.
Alternatively the quotes can grow toward 1.14100-1.14300.
The GBP/USD currency pair
Technical indicators of the currency pair:
Prev Open: 1.28911
Open: 1.29565
% chg. over the last day: +0.49
Day’s range: 1.29764 – 1.29847
52 wk range: 1.2438 – 1.4378
Yesterday GBP/USD showed an aggressive sell-off. The quotes grew by 100 points. The GBP is strengthening despite the weak reports from the UK labour market. The average wage including bonuses in November grew by 3.4% while the experts expected 3.3%. However, the number of applications for the unemployment benefits in December grew by 20.8K instead of 20K. You should open positions from the key levels of 1.29500 and 1.30000. A technical correction is possible soon.
The Economic News Feed for 23.01.2019 is calm.
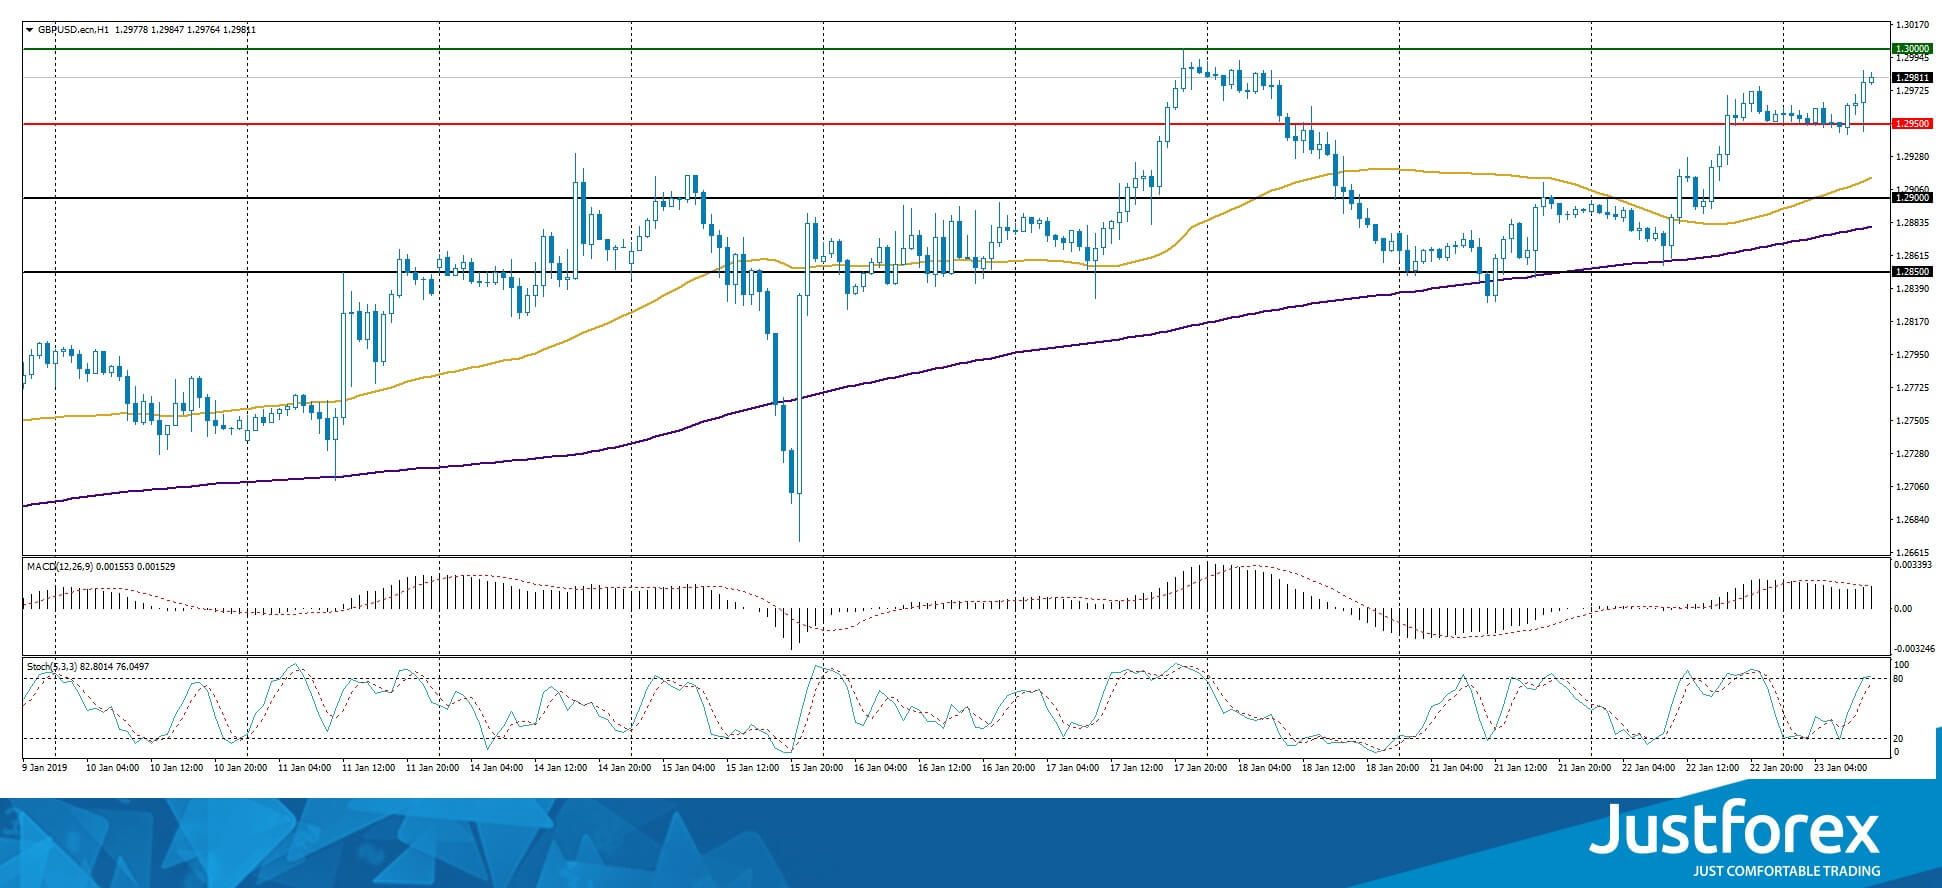
The indicators point to the power of the buyers, the price fixed above 50 MA and 200 MA.
The MACD histogram is in the positive zone and above the signal line, which gives a strong signal to buy GBP/USD.
The Stochastic Oscillator is close to the overbought zone, the %K line is above the %D line which points to a bullish mood.
Trading recommendations
Support levels: 1.29500, 1.29000, 1.28500
Resistance levels: 1.30000, 1.30400
If the price fxes above the round 1.30000, expect further growth toward 1.30400-1.30600.
Alternatively, the quotes can correct toward 1.29000-1.28800.
The USD/CAD currency pair
Technical indicators of the currency pair:
Prev Open: 1.32903
Open: 1.32903
% chg. over the last day: +0.49
Day’s range: 1.33267 – 1.33356
52 wk range: 1.2248 – 1.3664
Yesterday USD/CAD had an aggressive buy-out. The quotes grew by 70 points. CAD is weakened after the oil price fell by 2% due to the slow-down in the economic growth. You should open positions from the key levels of 1.33150 and 1.33400. The quotes have prospects for future growth.
At 15:30 (GMT +2:00) Canada will publish the basis index of retail sales.
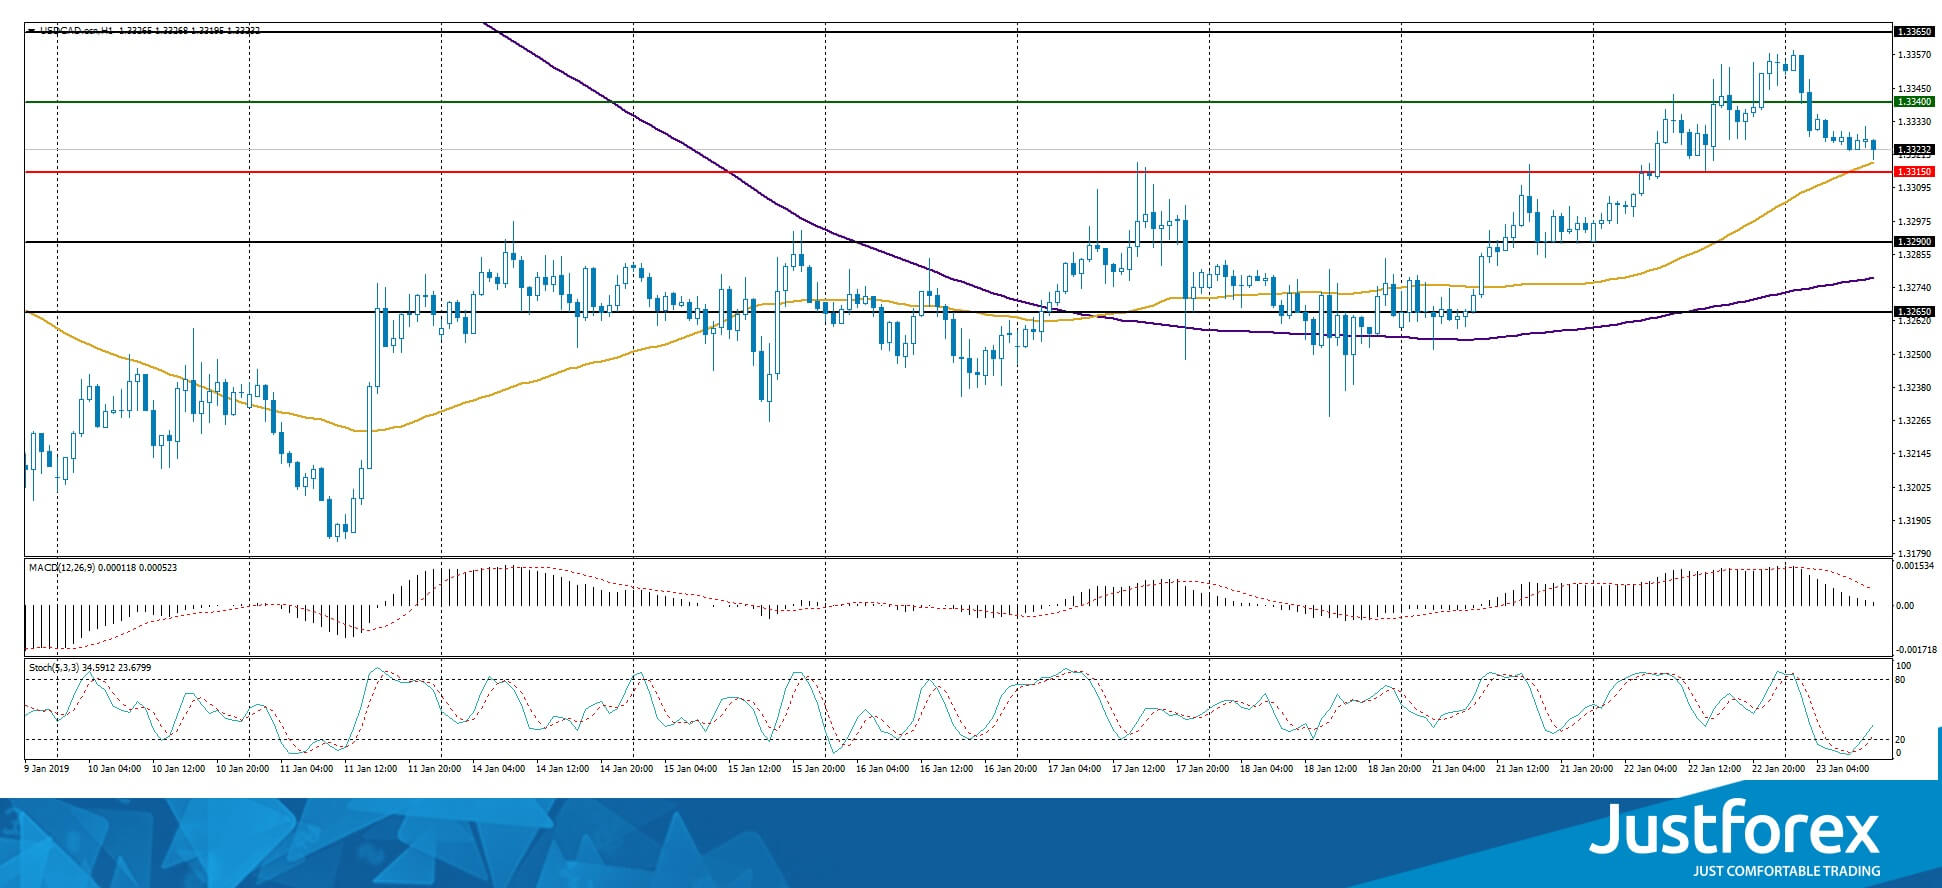
The price fixed above 50 MA and 200 MA which points to the power of the buyers.
The MACD histogram is close to 0.
The Stochastic Oscillator is leaving the oversold zone, the %K line is above the %D line, which gives a weak signal to buy USD/CAD.
Trading recommendations
Support levels: 1.33150, 1.32900, 1.32650
Resistance levels: 1.33400, 1.33650
If the price fixes above 1.33400, expect further growth toward 1.33650-1.34000.
Alternatively, the quotes can fall toward 1.32900-1.32650.
The USD/JPY currency pair
Technical indicators of the currency pair:
Prev Open: 109.651
Open: 109.651
% chg. over the last day: -0.28
Day’s range: 109.417 – 109.478
52 wk range: 104.56 – 114.56
USD/JPY is going through a variety of trends, the investors are waiting for additional drivers. The key resistance and support are 109.650 and 109.400. Open positions from these levels and keep an eye on the US Treasury bonds 10-year yield.
During the Asian trading session Japan published mixed economic reports.

The price fixed above 50 MA and 200 MA which points to the power of the buyers.
The MACD histogram moved to the positive zone which gives a strong signal to buy USD/JPY.
The Stochastic Oscillator is in the neutral zone, the %K line is crossing the %D line. There are no signals at the moment.
Trading recommendations
Support levels: 109.400, 109.100, 108.750
Resistance levels: 109.650, 109.900
If the price fixes above the key resistance of 109.650 consider selling USD/JPY. The movement will tend toward 109.000-110.100
Alternatively the quotes can fall toward 109.100-108.900.


