
The EUR/USD currency pair
Technical indicators of the currency pair:
Prev Open: 1.14026
Open: 1.13611
% chg. over the last day: -0.44
Day’s range: 1.13465 – 1.13683
52 wk range: 1.1214 – 1.2557
The USD keeps strengthening its positions against the world currencies. The demand remains at a high level. During the last two days of trading, EUR/USD fell by more than 50 points. Right now EUR is testing the local support of 1.13500. 1.13800 acts as a mirror resistance. The trading instrument has a tendency to descend. You should open positions from the key levels.
At 15:30 (GMT+2:00) the US will publish the primary data on the US benefits applications.
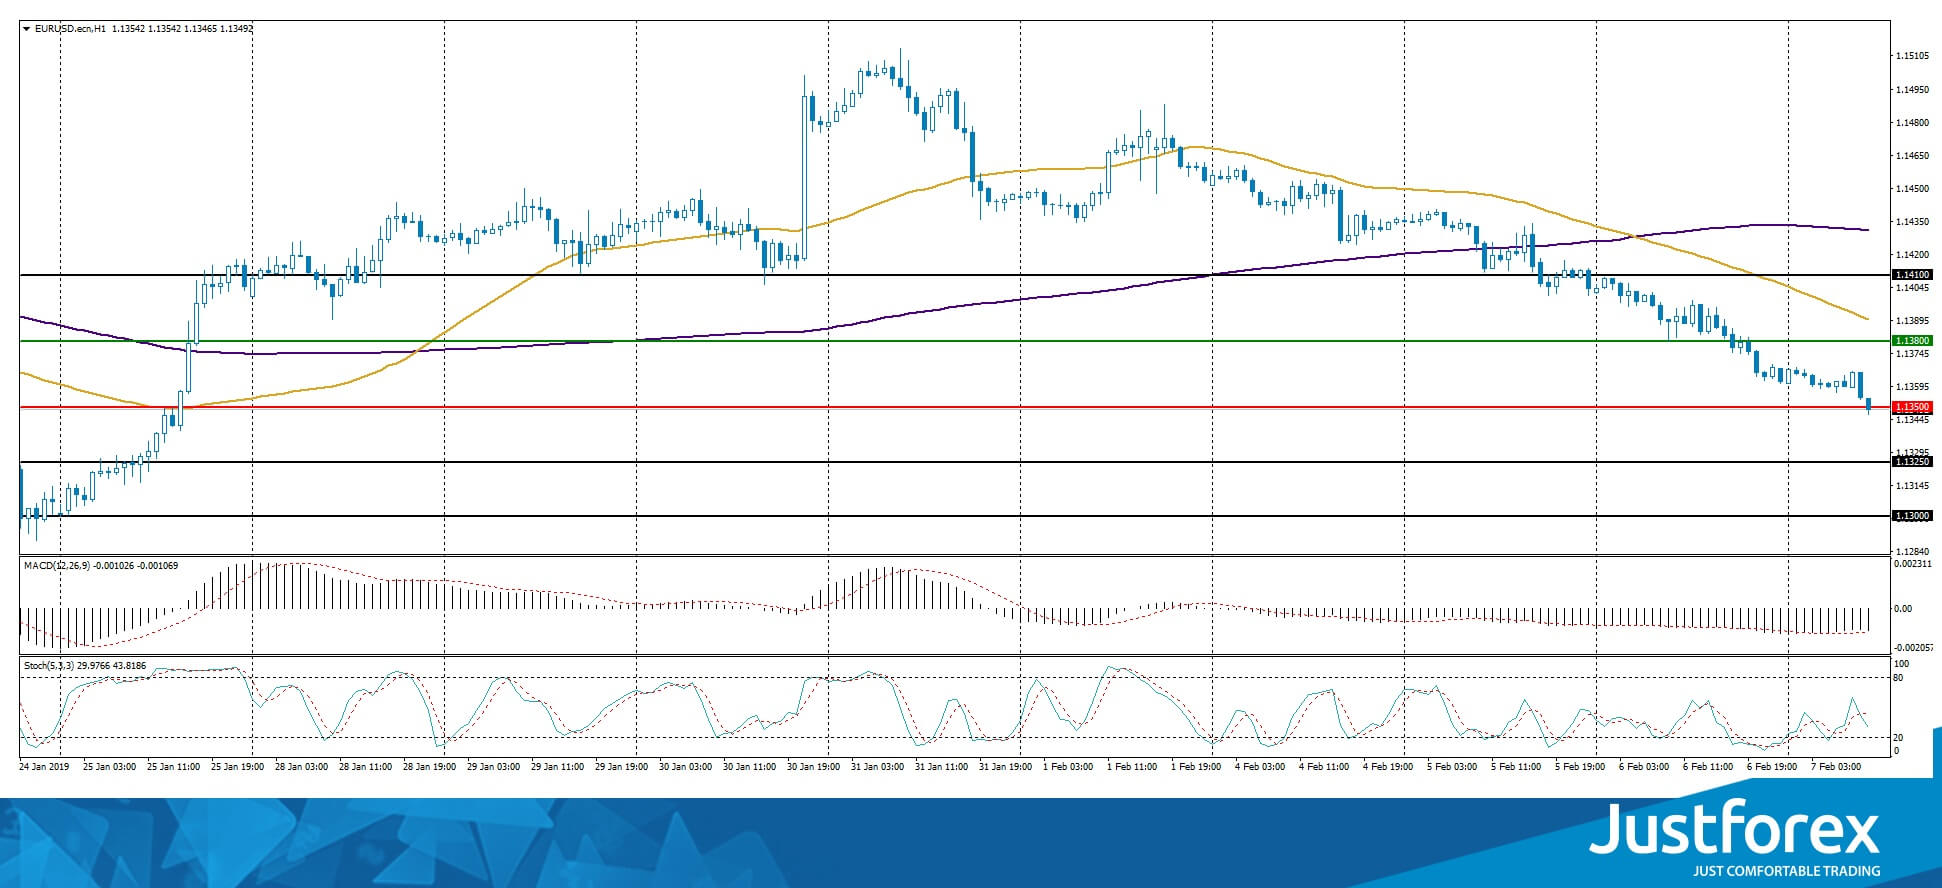
The price fixed below 50 MA and 200 MA which points to the power of the sellers.
The MACD histogram is in the negative zone but below the signal line, which gives a weak signal to sell EUR/USD.
The Stochastic Oscillator is in the neutral zone, the %K line is crossing the %D line. There are no signals.
Trading recommendations
Support levels: 1.13500, 1.13250, 1.13000
Resistance levels: 1.13800, 1.14100
If the price fixes below 1.13500 expect the quotes to fall toward 1.13250-1.13000.
Alternatively, the quotes can recover toward 1.14000-1.14200.
The GBP/USD currency pair
Technical indicators of the currency pair:
Prev Open: 1.29461
Open: 1.29296
% chg. over the last day: -0.11
Day’s range: 1.28972 – 1.29395
52 wk range: 1.2438 – 1.4378
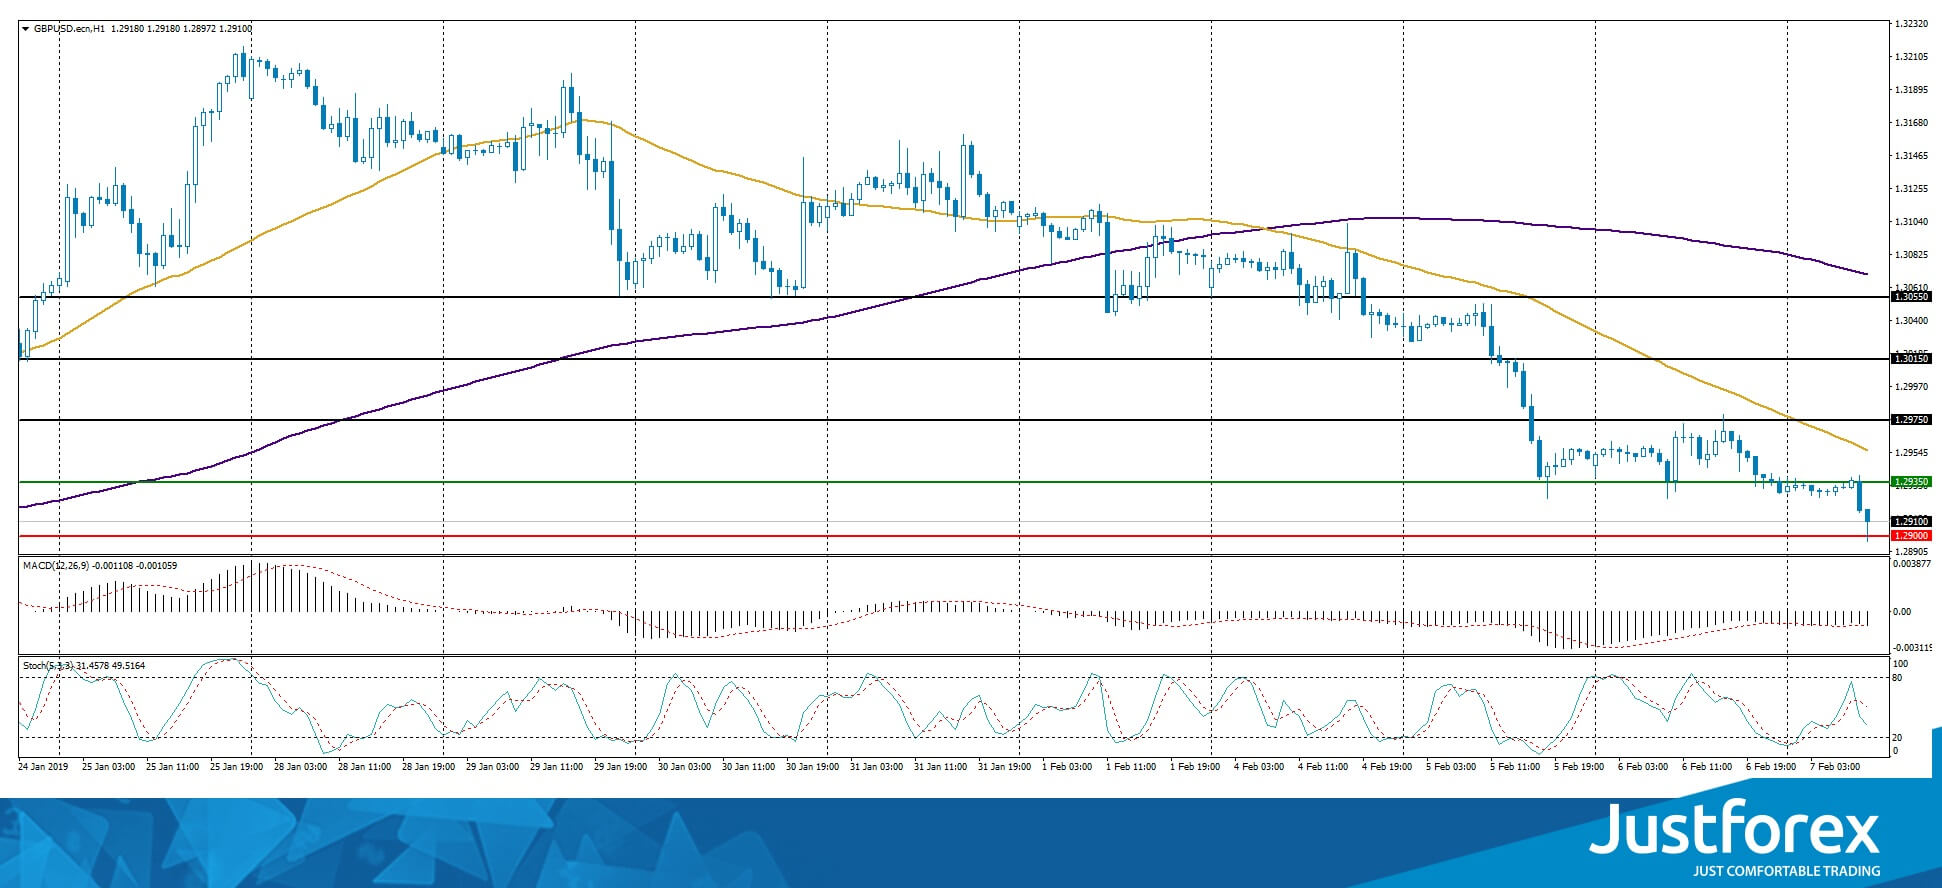
GBP/USD keeps showing a negative trend. The pound is consolidating around the round 1.29000. The local resistance is 1.29350. The financial market participants are waiting for the Bank of England meeting. The regulator is expected to keep the main paramenters of monetary policy at the same level. You should look for market entry points at the key levels.
At 14:00 (GMT+2:00) the Bank of England will publish the new key interest rate.

The price fixed below 50 MA and 200 MA which points to the power of the buyers.
The MACD histogram is in the negative zone and keeps descending which gives a strong signal to sell GBP/USD.
The Stochastic Oscillator is in the neutral zone, the %K line is below the %D line which points to a bearish mood.
Trading recommendations
Support levels: 1.29000, 1.28500
Resistance levels: 1.29350, 1.29750, 1.30150
If the price fixes below the round 1.29000 expect the quotes to fall toward 1.28500-1.28250.
Alternatively, the quotes can recover toward 1.29750-1.30000.
The USD/CAD currency pair
Technical indicators of the currency pair:
Prev Open: 1.31357
Open: 1.32099
% chg. over the last day: +0.66
Day’s range: 1.32036 – 1.32535
52 wk range: 1.2248 – 1.3664
The USD recovered the majority of the losses regarding the CAD after a fall at the beginning of January. During the last two days of trading, the quotes grew by 100 points. Right now the key levels are 1.32300 and 1.32600. There are prospects for further growth. Keep an eye on the oil quotes dynamics and open positions from the key levels.
The Economic News Feed for 07.02.2019 is calm.
The indicators do not provide precise signals: 50 MA started to cross 200 MA.
The MACD histogram is in the positive zone and above the signal line, which points to a bullish mood.
The Stochastic Oscillator is out of the overbought zone, the %K line is below the %D line which gives a signal to sell USD/CAD.
Trading recommendations
Support levels: 1.32300, 1.32000, 1.31550
Resistance levels: 1.32600, 1.32850, 1.33150
If the price fixes above the local resistance of 1.32600 expect the quotes to grow toward 1.33000-1.33250.
Alternatively, the quotes can fall toward the round 1.32000.
The USD/JPY currency pair
Technical indicators of the currency pair:
Prev Open: 109.955
Open: 109.964
% chg. over the last day: +0.01
Day’s range: 109.725 – 110.086
52 wk range: 104.56 – 114.56
USD/JPY keeps trading in a long flat. There is no single defined trend. The demand on the safe haven currencies remains during the next round of the Washigton/Beijing negotiations. The USD/JPY quotes are testing the key resistance level of 110.000-110.150. 109.800 acts as a local support. You should open positions from these levels.
The Economic News Feed for 07.02.2019 is calm.
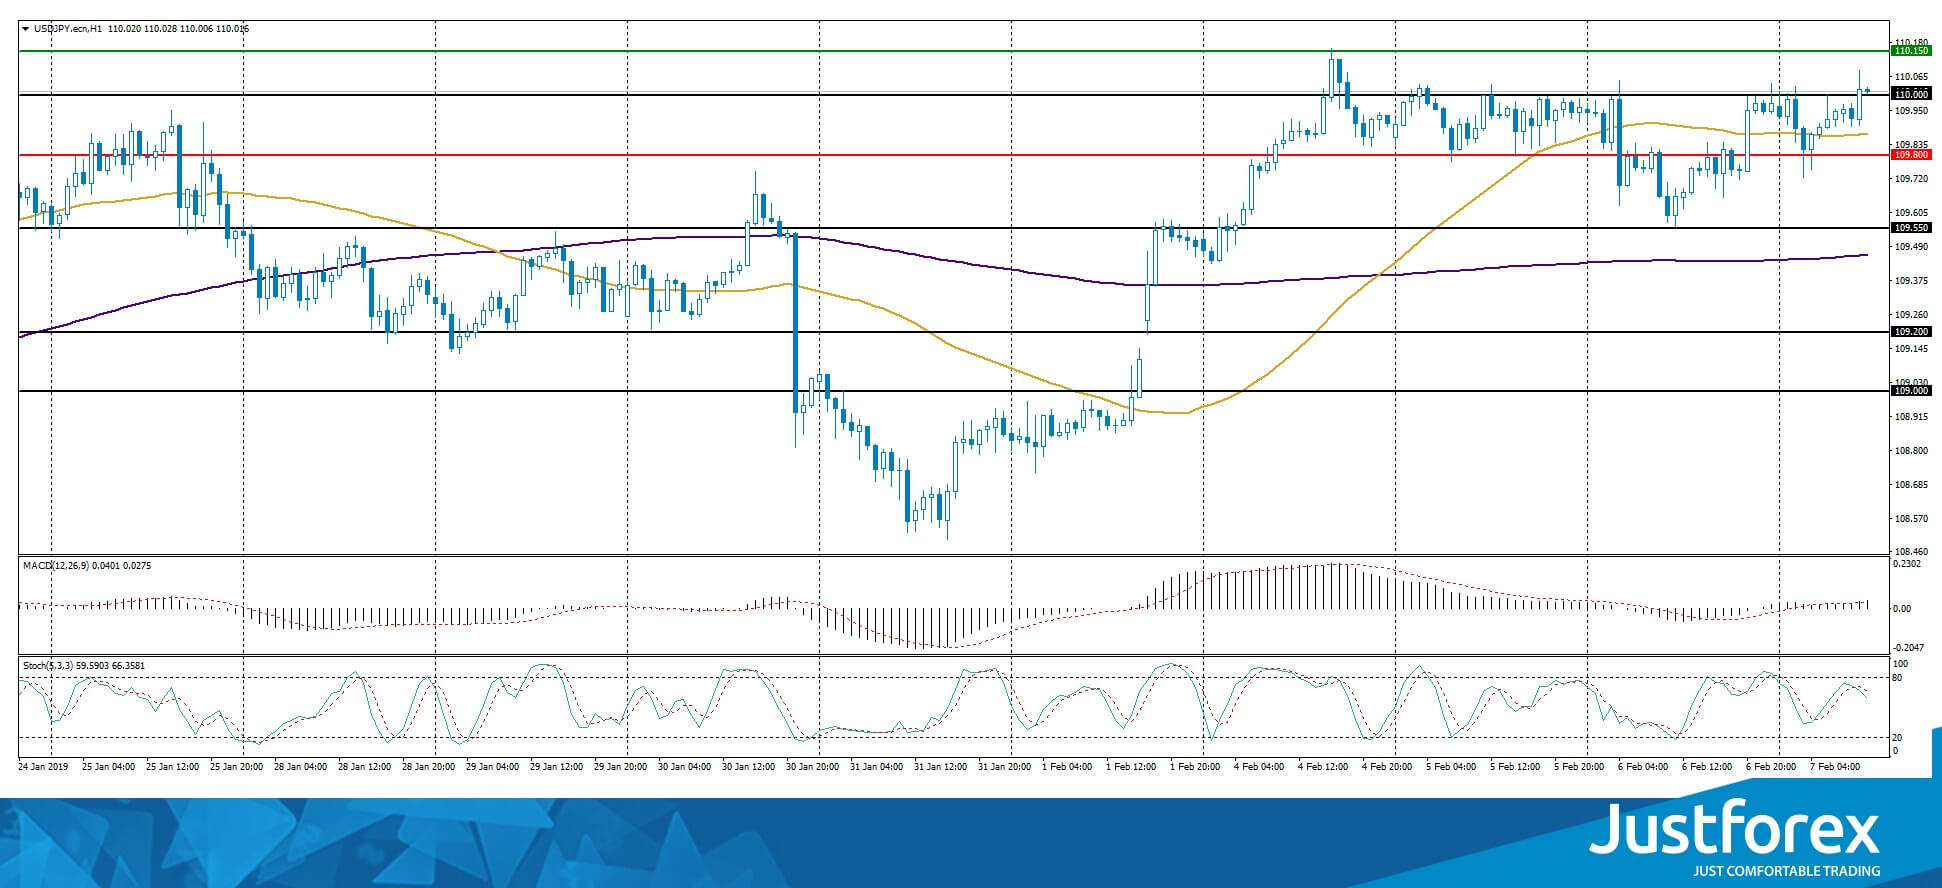
The price fixed above 50 MA and 200 MA which points to the power of the buyers.
The MACD histogram is in the positive zone and keeps rising which also points to the bullish mood.
The Stochastic Oscillator is in the neutral zone, the %K line is below the %D line which also gives a signal to sell USD/JPY.
Trading recommendations
Support levels: 109.800, 109.550, 109.200
Resistance levels: 110.000, 110.150, 110.500
If the price fixes above 110.150 expect the quotes to grow toward 110.500-110.700.
Alternatively, the quotes can descend toward 109.500-109.300.


