
The EUR/USD currency pair
Technical indicators of the currency pair:
Prev Open: 1.13611
Open: 1.13383
% chg. over the last day: -0.21
Day’s range: 1.13320 – 1.13439
52 wk range: 1.1214 – 1.2557
EUR/USD remains in a bearish mood. Yesterday EUR updated the local minimums again. Right now the quotes are consolidating. The local support and resistance levels are 1.13250 and 1.13450 respectively. The trading relationships between the US and China are once again on the edge. The EU worsened the expectations for 2019. The currency pair has prospects for further descend. You should seek market entry points at the key levels.
The Economic News Feed for 08.02.2019 is calm.
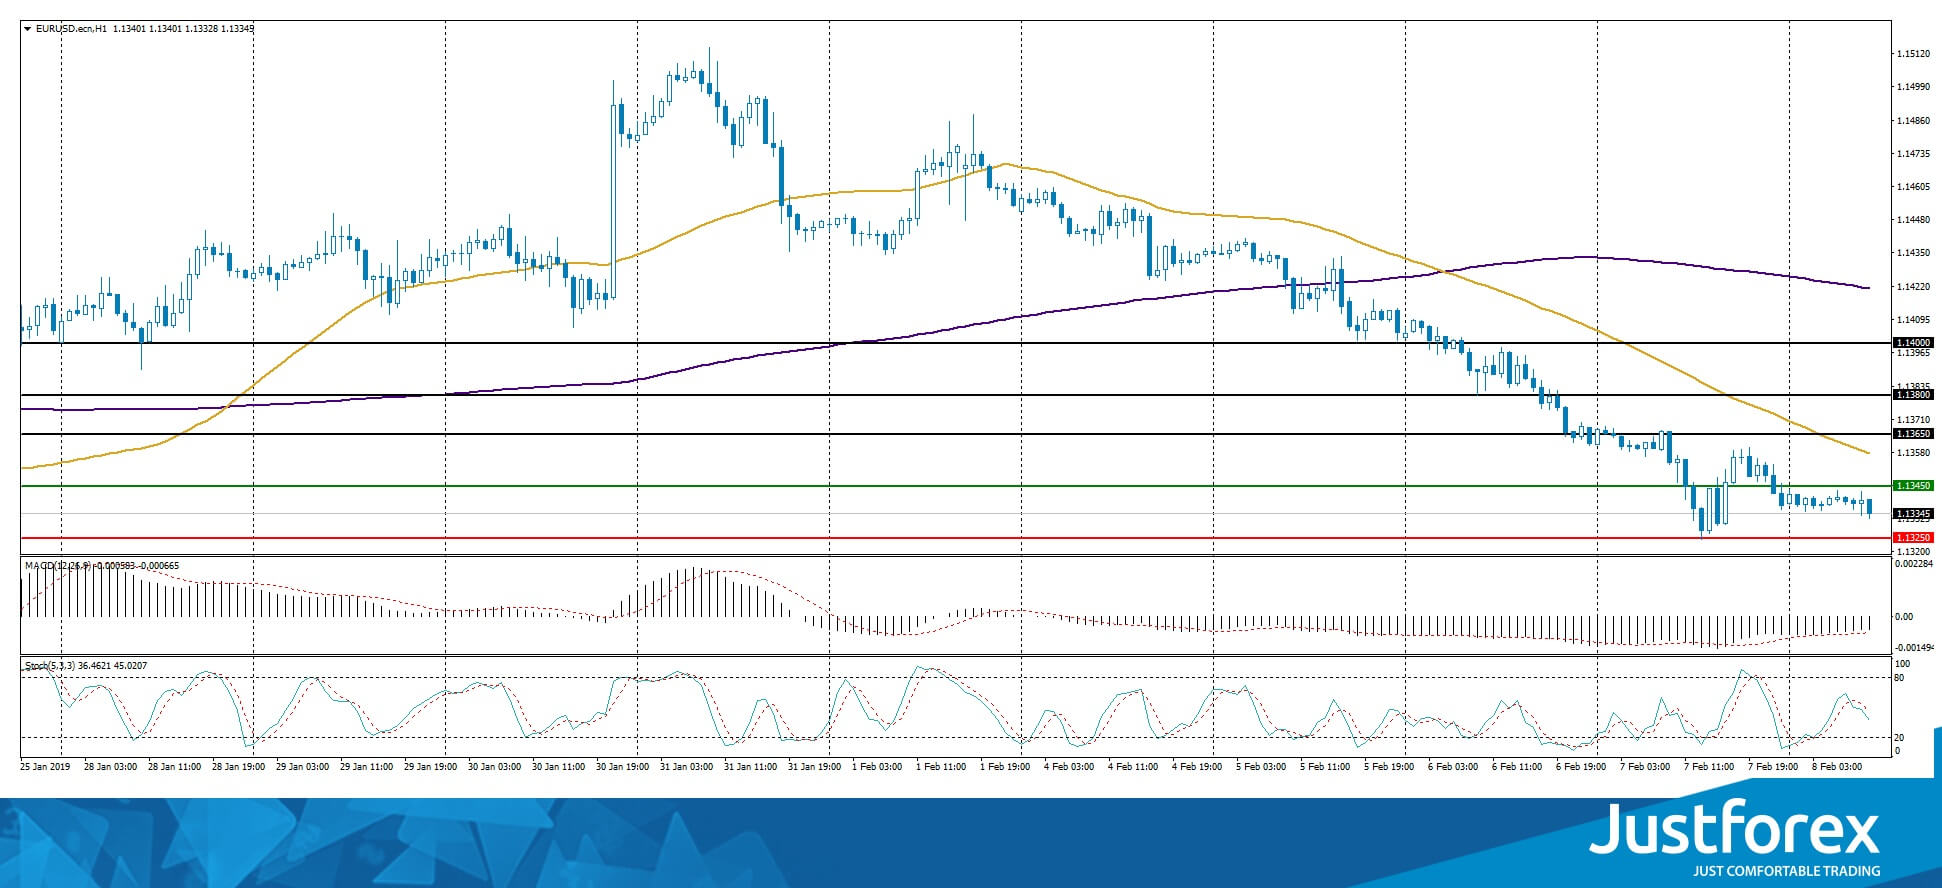
The price fixed below 50 MA and 200 MA which points to the power of the buyers.
The MACD histogram is in the negative zone but above the signal line which gives a weak signal to sell EUR/USD.
The Stochastic Oscillator is in the neutral zone, the %K is below the %D line which points to bearish mood.
Trading recommendations
Support levels: 1.13250, 1.13000, 1.12500
Resistance levels: 1.13450, 1.13650, 1.13800
If the price fixes below 1.13250 expect the further descend toward 1.13000-1.12750.
Alternatively, the quotes can correct toward 1.13750-1.14000.
The GBP/USD currency pair
Technical indicators of the currency pair:
Prev Open: 1.29296
Open: 1.29480
% chg. over the last day: +0.11
Day’s range: 1.29251 – 1.29582
52 wk range: 1.2438 – 1.4378
Yesterday GBP/USD had shown a lot of trading activity and volatility. As expected, the Bank of England kept the key interest rate at 0.75%. The regulator worsened the UK economic growth forecast. At the same time, the Bank does not exclude slow growth of the interest rates should the Brexit succeed. Right now the quotes are consolidating around 1.29250-1.29650. You should open positions from these levels.
The Economic News Feed for 08.02.2019 is calm.
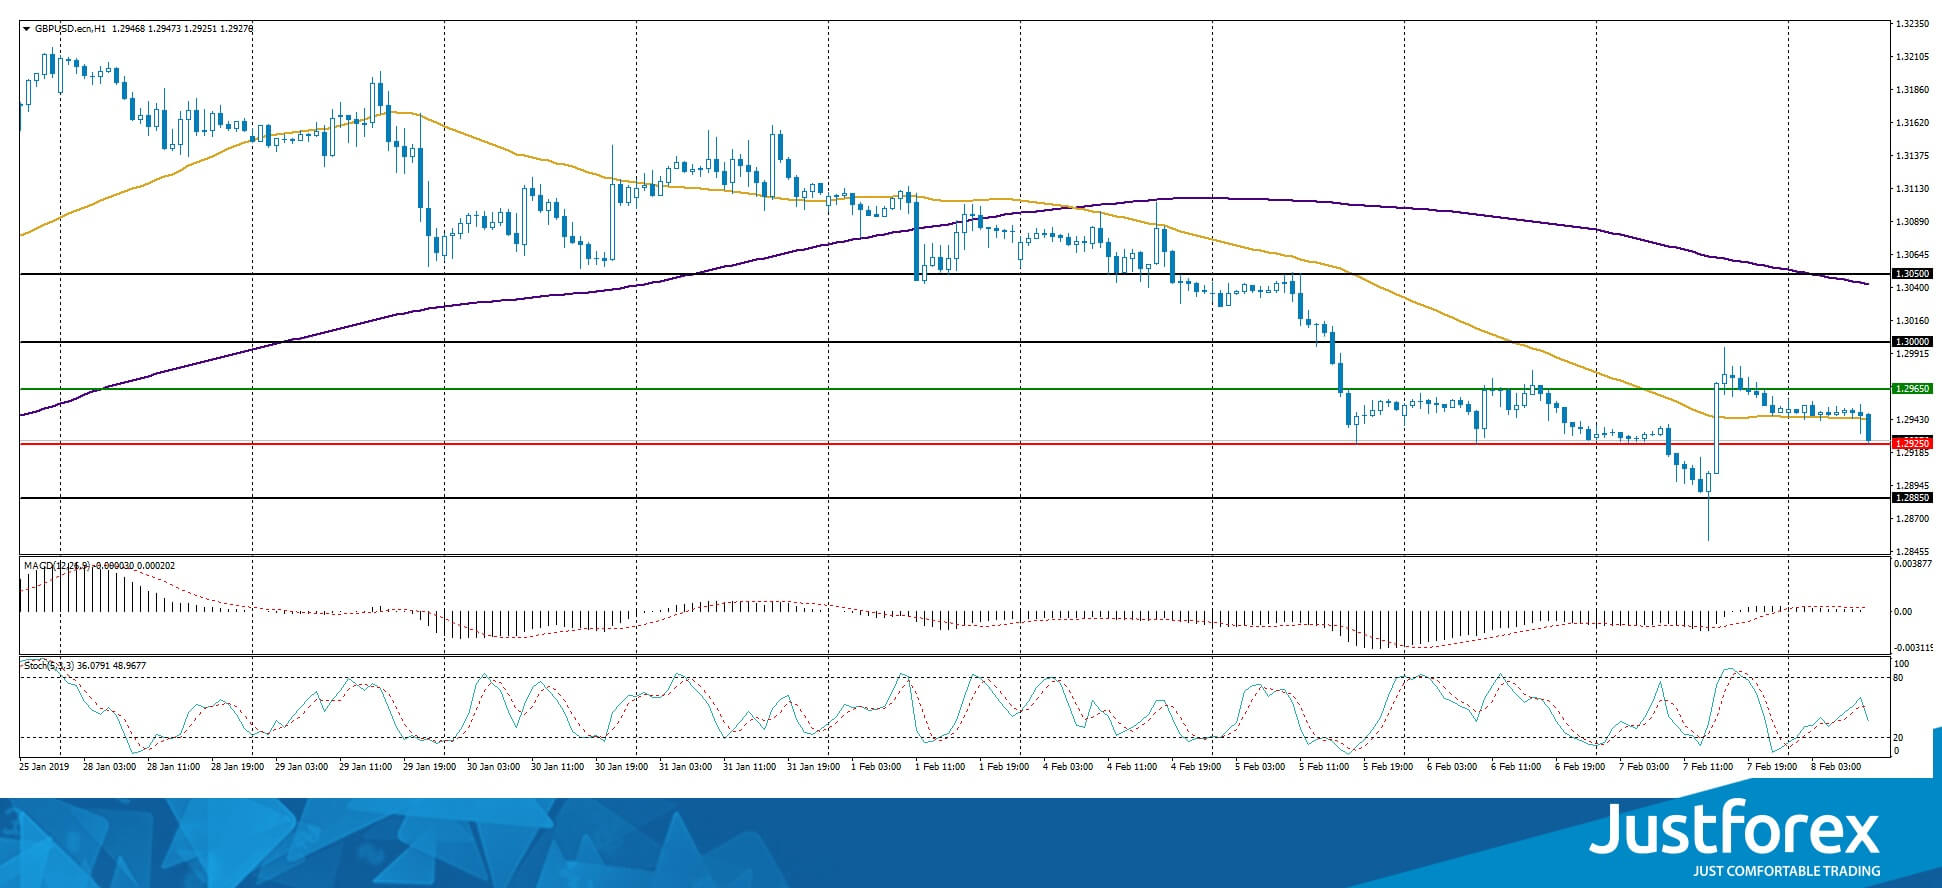
The indicators do not provide precise signals, the price has crossed 50 MA.
The MACD histogram is close to 0.
The Stochastic Oscillator is in the neutral zone, the %K line is crossing the %D line. There are no signals at the moment.
Trading recommendations
Support levels: 1.29250, 1.28850
Resistance levels: 1.29650, 1.30000, 1.30500
If the price fixes below 1.29250 consider selling GBP/USD. The movement will tend toward 1.28850-1.28500.
Alternatively, the price can recover toward 1.30000.
The USD/CAD currency pair
Technical indicators of the currency pair:
Prev Open: 1.32099
Open: 1.32979
% chg. over the last day: +0.74
Day’s range: 1.32978 – 1.33291
52 wk range: 1.2248 – 1.3664
Yesterday USD/CAD started to show a positive dynamic. The CAD is weakened against the USD by more than 100 points. The trading instrument updated the key extremums. The quotes are testing the range of 1.32850-1.33250. The currency pair has good growth prospects. An addtional pressure on the CAD is caused by the poor oil quotes dynamics.
At 15:30 (GMT+2:00) Canada will publish a Labour Market report.
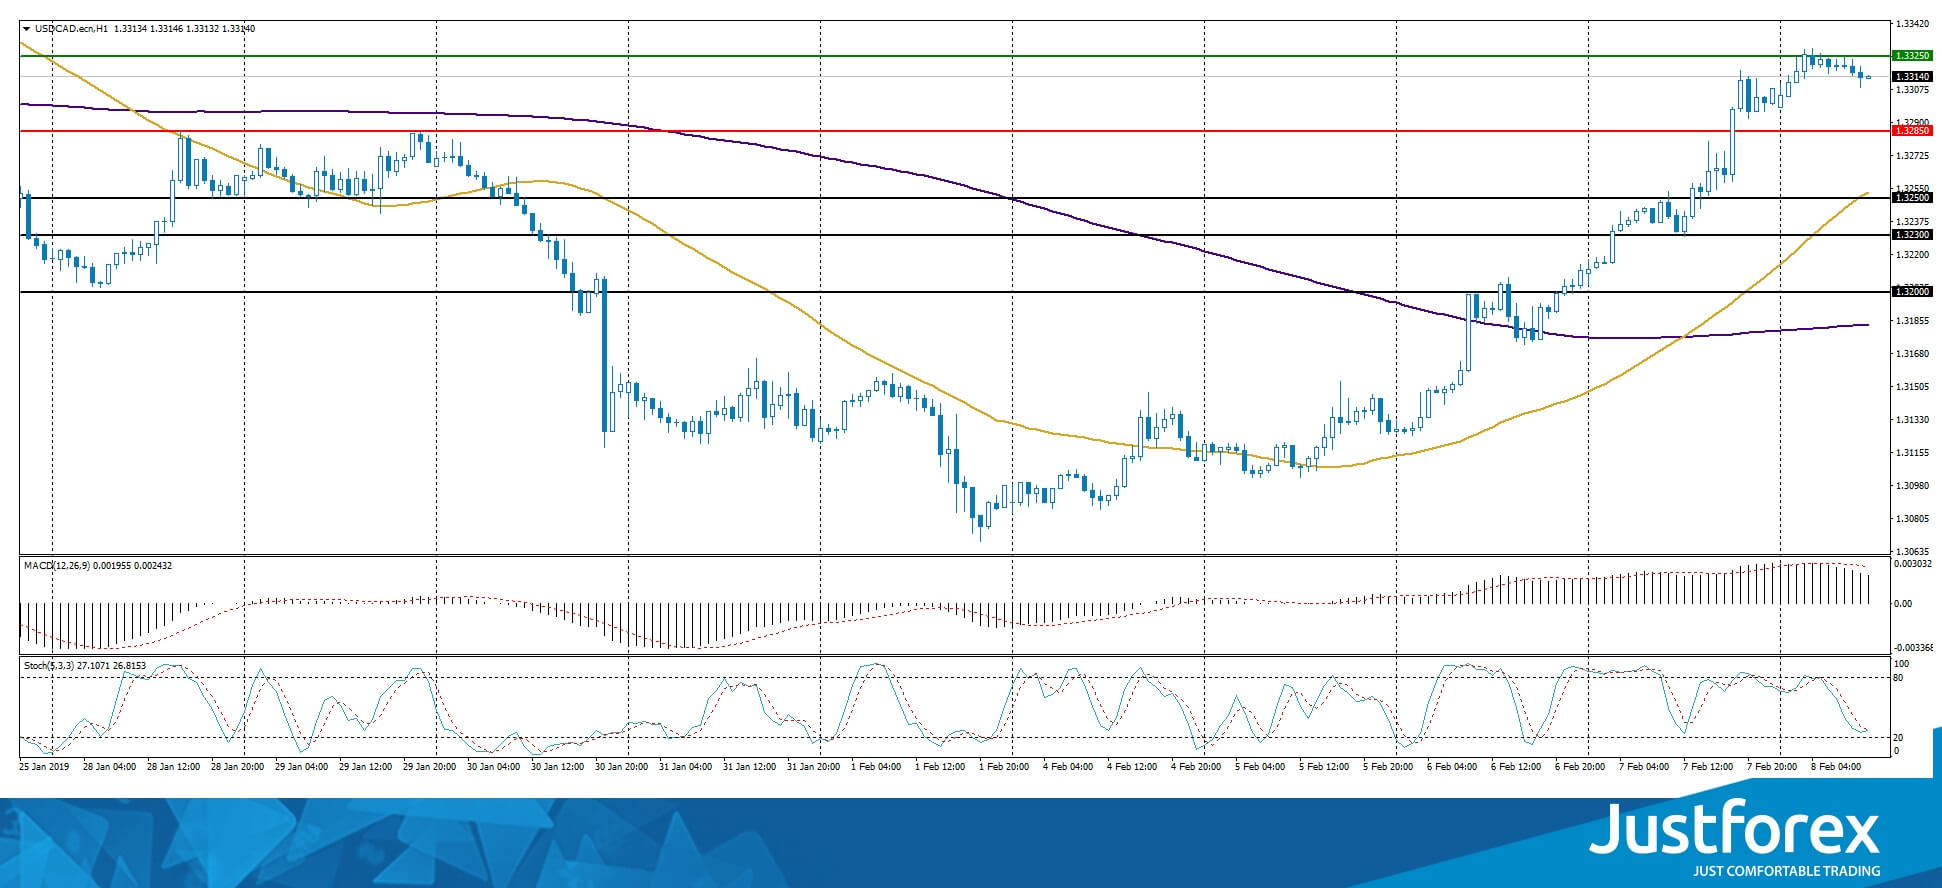
The price fixed above 50 MA and 200 MA which shows the power of the buyers.
The MACD histogram is in the positive zone but below the signal line which gives a weak signal to buy USD/CAD.
The Stochastic Oscillator is in the neutral zone, the %K line is crossing the %D line. There are no signals at the moment.
Trading recommendations
Support levels: 1.32850, 1.32500, 1.32300
Resistance levels: 1.33250, 1.33600
If the price fixed above the local resistance of 1.33250, expect the quotes to grow further. The movement will tend toward 1.33600-1.33800.
Alternatively, the quotes can descend toward 1.32600-1.32400.
The USD/JPY currency pair
Technical indicators of the currency pair:
Prev Open: 109.964
Open: 109.790
% chg. over the last day: -0.20
Day’s range: 109.648 – 109.898
52 wk range: 104.56 – 114.56
The safe haven currency keeps moving sideways. There is no single defined trend. The local levels are 109.550-109.700 and 110.000-110.150. The demand for the safe assets remains due to Washington/Beijing trading dispute. Keep an eye on it and open positions from the key levels.
The Economic News Feed for 08.02.2019 is calm.
The indicators do not provide precise signals, the price has crossed 50 MA.
The MACD histogram is close to 0.
The Stochastic Oscillator is in the neutral zone, the %K line is above the %D line, which gives a signal to buy USD/JPY.
Trading recommendations
Support levels: 109.550, 109.200, 109.000
Resistance levels: 110.000, 110.150, 110.500
If the price fixes above 110.150 expect the quotes to grow toward 110.500-110.700.
Alternatively the quotes can correct toward 109.400-109.200.


