
The EUR/USD currency pair
Technical indicators of the currency pair:
Prev Open: 1.12602
Open: 1.12939
% chg. over the last day: +0.25
Day’s range: 1.12715 – 1.12969
52 wk range: 1.1214 – 1.2557
EUR/USD has an ambiguous technical picture. Right now the quotes are consolidating after a long fall. The demand for USD remains high. The investors are waiting for additional drivers. The US/China negotiations and Donald Trump`s edicts regarding the White House operations are in the spotlight. The local support and resistance levels are 1.12700 and 1.13000. You should open positions from these levels.
At 15:30 (GMT+2:00) the US will publish an array of economic reports. Keep an eye on the difference between the real and forecasted data.
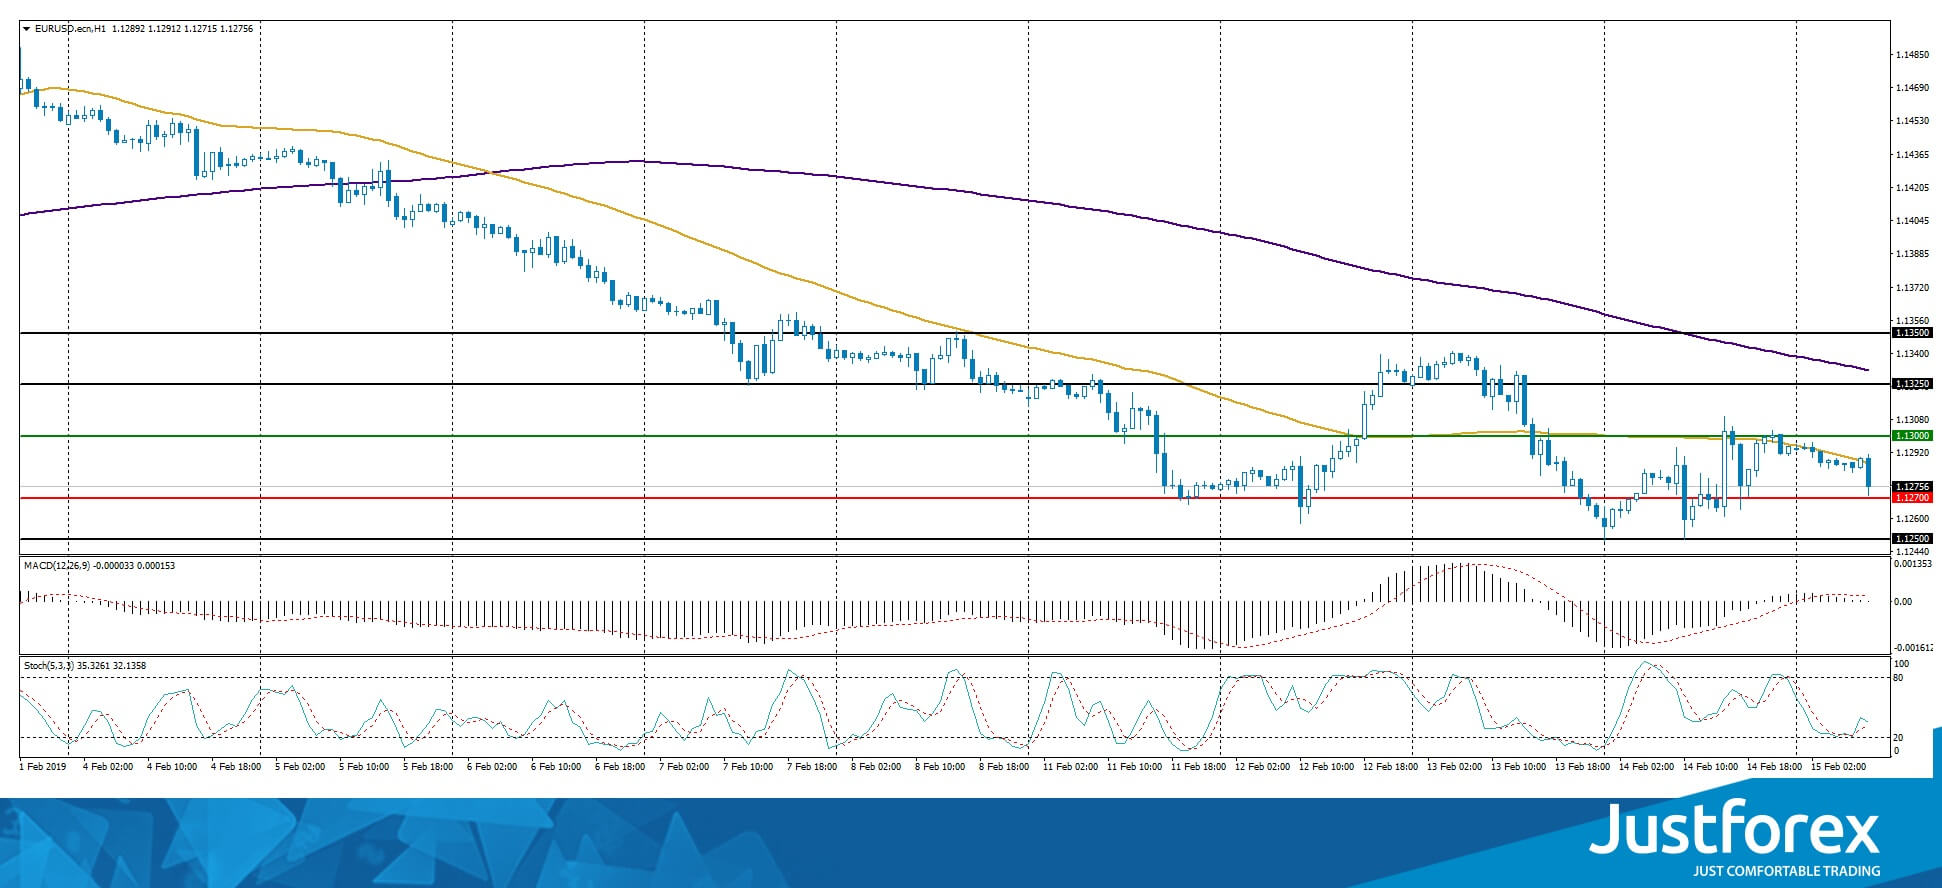
The indicators do not provide precise signals, the price has crossed 50 MA.
The MACD is close to 0
The Stochastic Oscillator is in the neutral zone, the %K line has started to cross the %D line. There are no signals at the moment.
Trading recommendations
Support levels: 1.12700, 1.12500, 1.12000
Resistance levels: 1.13000, 1.13250, 1.13500
If the price fixes below 1.12700 expect the quotes to fall toward 1.12300-1.12000.
Alternatively, the quotes can recover toward 1.13250-1.13500.
The GBP/USD currency pair
Technical indicators of the currency pair:
Prev Open: 1.28444
Open: 1.27972
% chg. over the last day: -0.37
Day’s range: 1.27891 – 1.28226
52 wk range: 1.2438 – 1.4378
The pound remains under pressure due to the Brexit conundrum and weak economic reports. Yesterday, the parliament of the UK refused Theresa May’s proposal to move the Brexit date. Right now the quotes are consolidating at 1.27800-1.28200. You should open positions from these levels.
At 11:30 (GMT+2:00) the UK will publish the retail sales report.
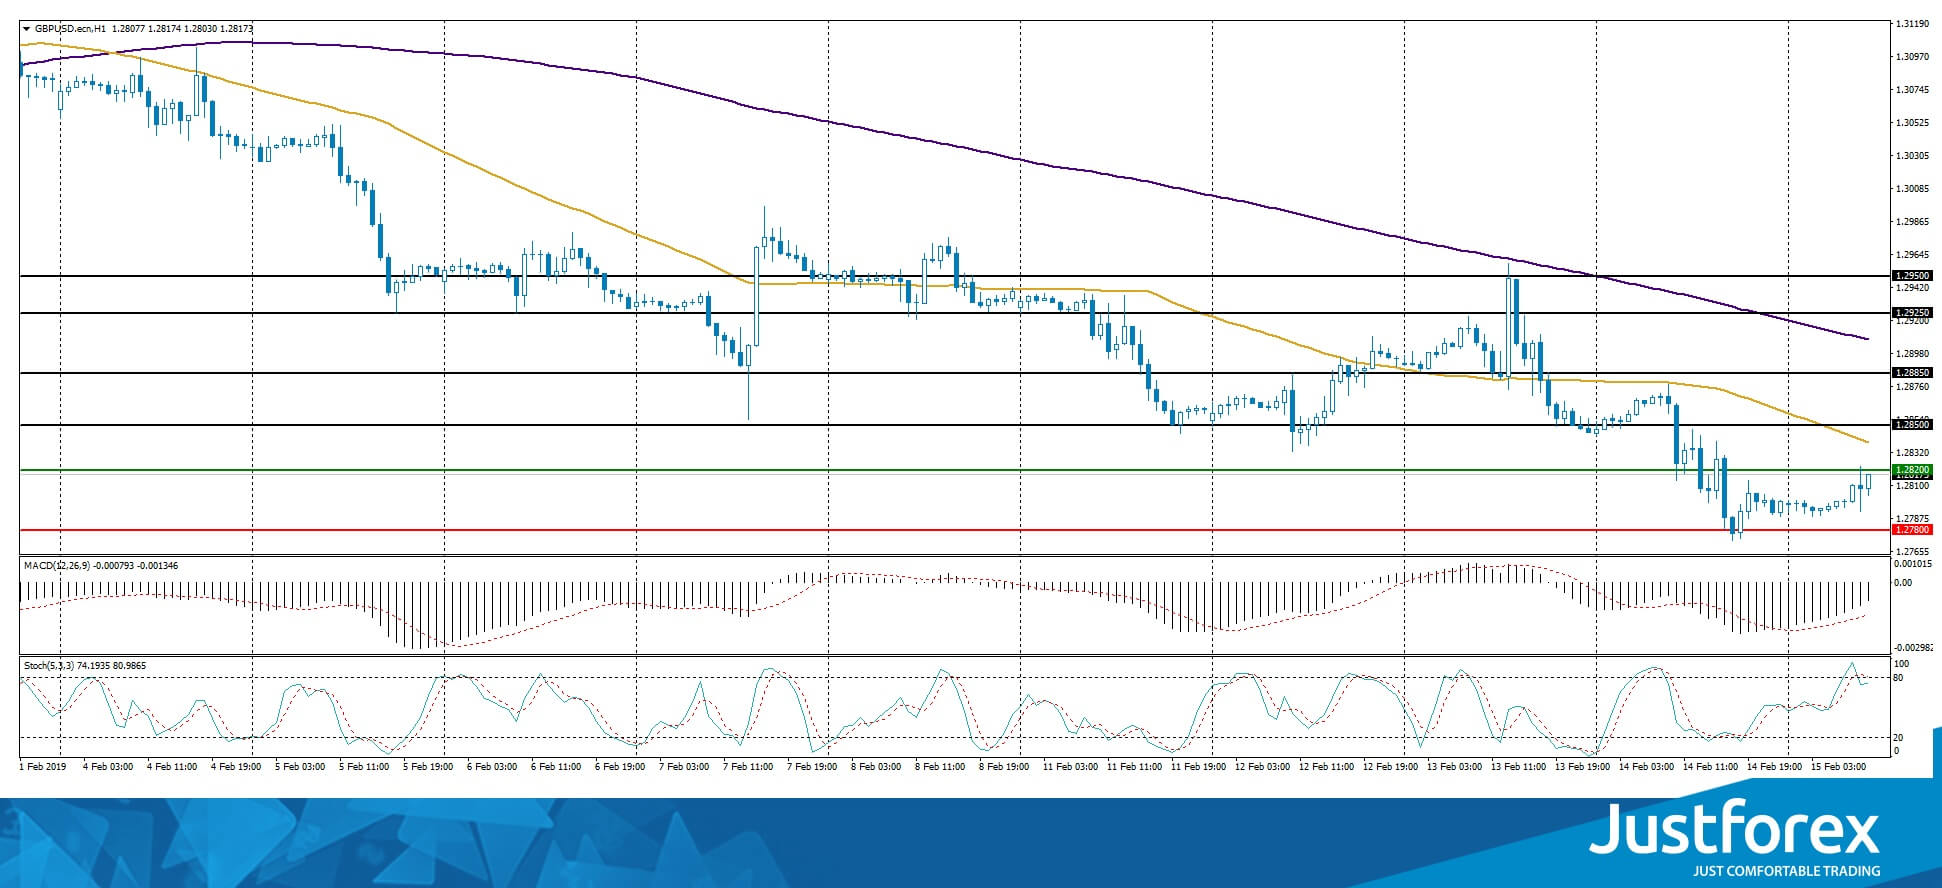
The price fixed below 50 MA and 200 MA which points to the power of they buyers.
The MACD histogram is in the negative zone but above the signal line which gives a weak signal to sell GBP/USD.
The Stochastic Oscillator is close the the overbought zone, the %K line is crossing the %D line. There are no signals at the moment.
Trading recommendations
Support levels: 1.27800, 1.27500, 1.27000
Resistance levels: 1.28200, 1.28500, 1.28850
If the price fixes below 1.27800 expect the quotes to fall toward 1.27500-1.27300.
Alternatively, the quotes can recover toward 1.28600-1.28900.
The USD/CAD currency pair
Technical indicators of the currency pair:
Prev Open: 1.32520
Open: 1.32905
% chg. over the last day: +0.30
Day’s range: 1.32878 – 1.33128
52 wk range: 1.2248 – 1.3664
USD/CAD is consolidating close to the monthly maximums. The technical picture is ambigous. The local support and resistance levels are 1.32900 and 1.33250. You should open positions from these levels. Keep an eye on the US economic reports and the oil quotes dynamics.
The Economic News Feed for 15.02.2019 is calm.
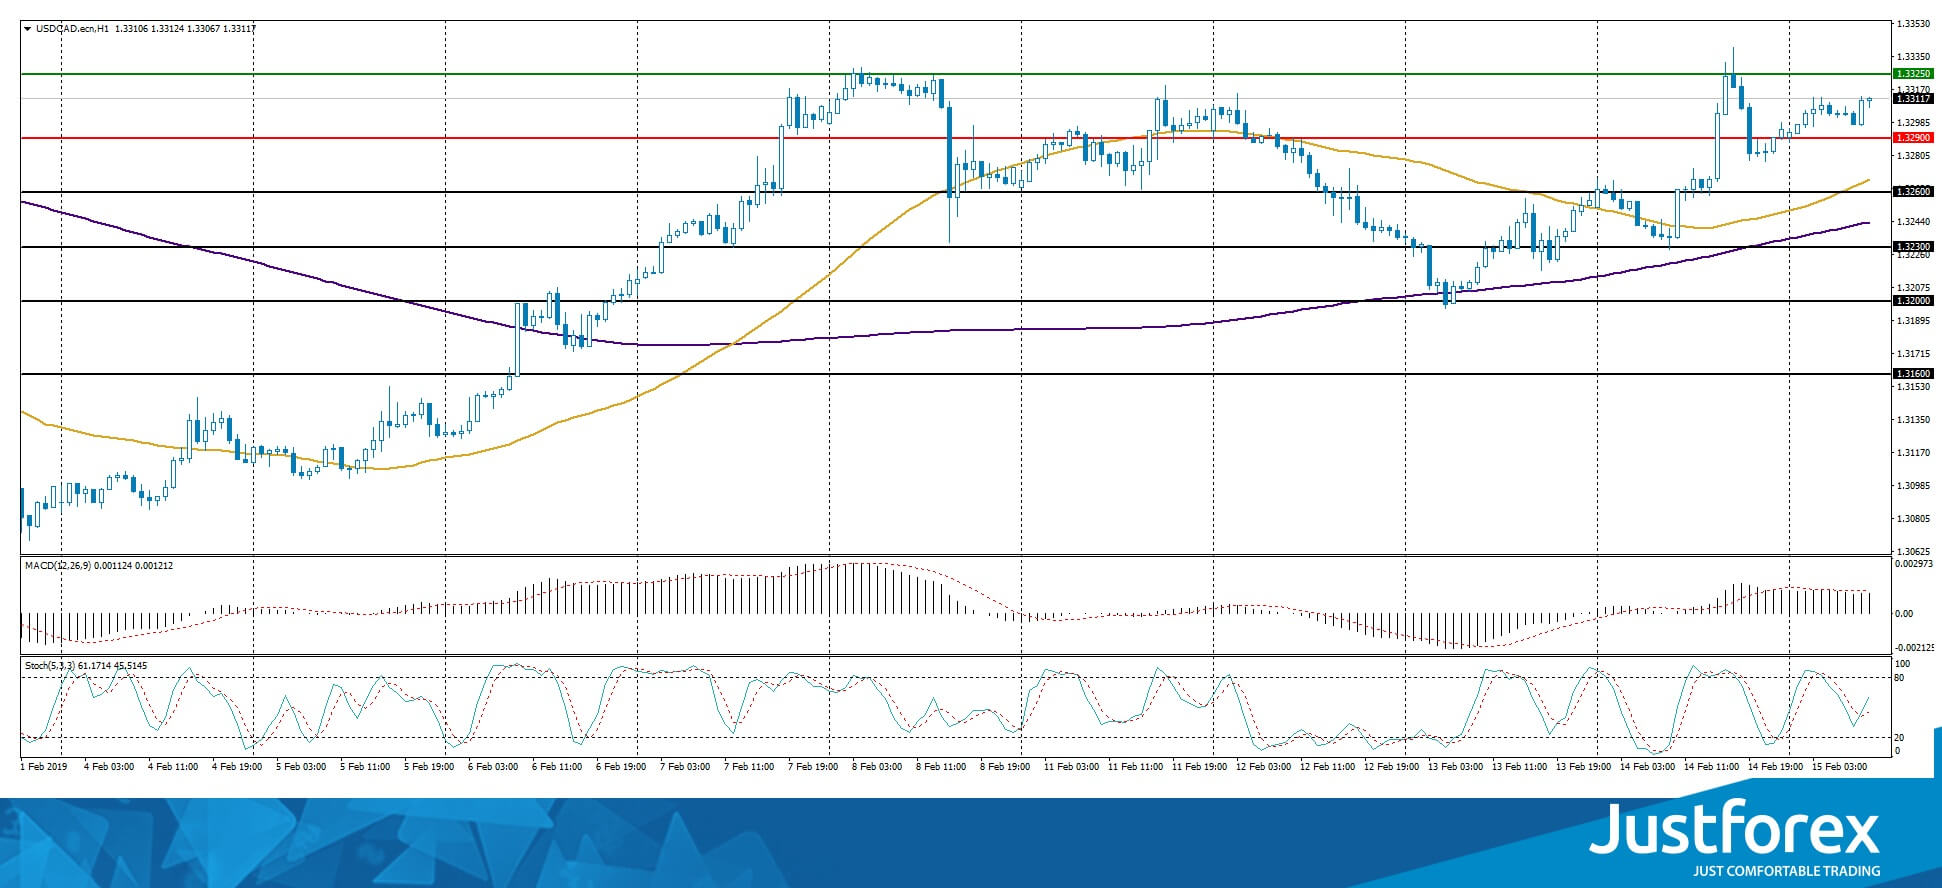
The indicators point to the power of the buyers, the price fixed above 50 MA and 200 MA.
The MACD histogram is in the positive zone, but below the signal line which gives a weak signal to sell USD/CAD.
The Stochastic Oscillator is in the negative zone, the %K line is above the %D line which points to a bullish mood.
Trading recommendations
Support levels: 1.32900, 1.32600, 1.32300
Resistance levels: 1.33250, 1.33600
If the price fixes above 1.33250, expect the quotes to grow toward 1.33600-1.33800.
Alternatively, the quotes can fall toward 1.32600-1.32300.
The USD/JPY currency pair
Technical indicators of the currency pair:
Prev Open: 110.972
Open: 110.440
% chg. over the last day: -0.41
Day’s range: 110.257 – 110.550
52 wk range: 104.56 – 114.56
The USD/JPY started to descend. During the last tow days of trading, the quotes fell by 60 points. The safe haven currency updated the key extremums and is consolidating around 110.250-110.500. The quotes have a tendency to descend further. Keep an eye on the US news feed and open positions from the key levels.
The Economic News Feed for 15.02.2019 is calm.
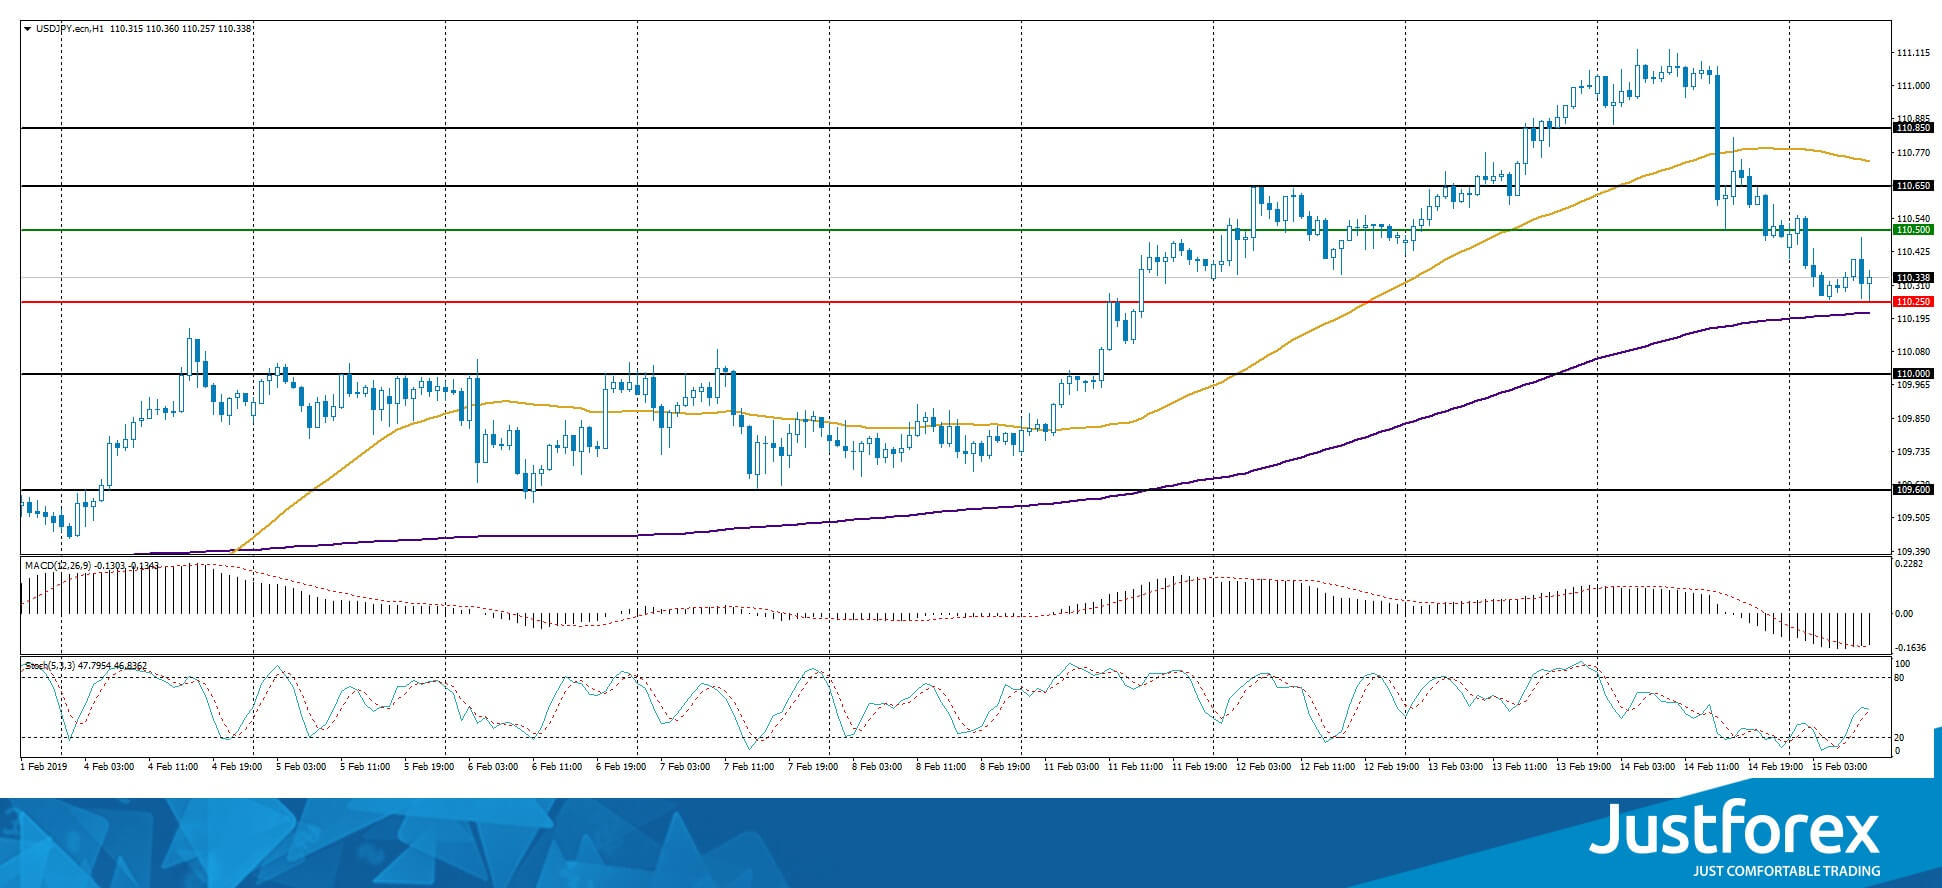
The indicators do not provide precise signals, the price fixed between 50 MA and 200 MA.
The MACD histogram is in the negative zone but above the signal line, which gives a weak signal to sell USD/JPY.
The Stochastic Oscillator is in the neutral zone the %K line is crossing the %D line. There are no signals at the moment.
Trading recommendations
Support levels: 110.250, 110.000, 109.600
Resistance levels: 110.500, 110.650, 110.850
If the price fixes below 110.250, expect the quotes to fall toward 110.000-109.800.
Alternatively, the quotes can grow toward 110.700-110.900.


