In this technical blog, we are going to take a look at the past performance of AUDCAD Elliott Wave 1-Hour Charts that we presented to our members. In which, the bounce to 1/31/2019 peak (0.9581) ended wave X bounce. Down from there, wave (w) ended in a lesser degree zigzag structure where wave (a) ended at 0.9450, wave (b) bounce ended at 0.9523 high. Wave (c) ended at 0.9375 low and finally completed wave (w) at 0.9375 low. Up from there, the pair corrected the decline from 0.9581 peak in wave (x) bounce. We will explain the structure of that bounce & forecast below.
AUDCAD Elliott Wave 1 Hour Chart From 2/20/2019
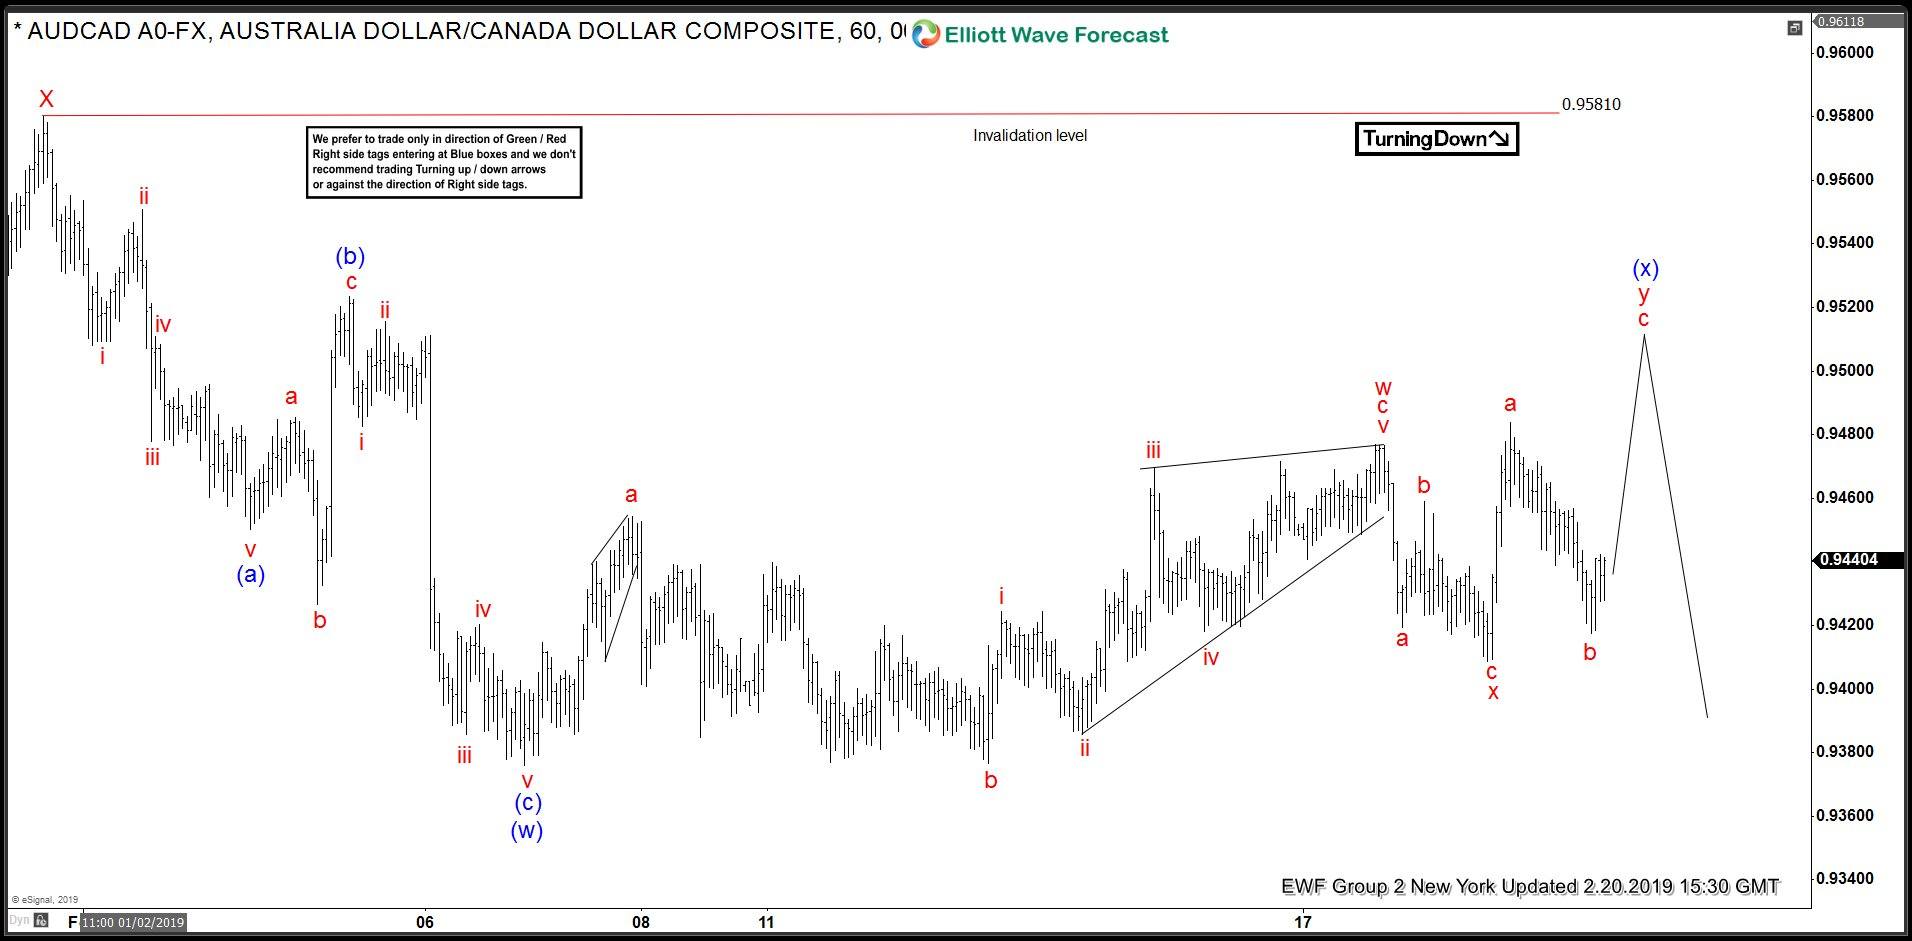
Above is the 1-hour Chart from 2/20/2019 New York update, in which the pair is correcting the short-term cycle from 1/31/2019 peak (0.9581) in wave (x) bounce. The internal of that bounce unfolded as Elliott wave double three structure. Also known as 7 swings structure where lesser degree wave w ended in 3 swings as a Flat correction at 0.9476 high. Down from there, wave x ended in lesser degree zigzag structure at 0.9408 low. Above from there, wave y of (x) higher was expected to take place as Elliott wave zigzag structure before downside resume.
AUDCAD Elliott Wave 1 Hour Chart from 2/21/2019
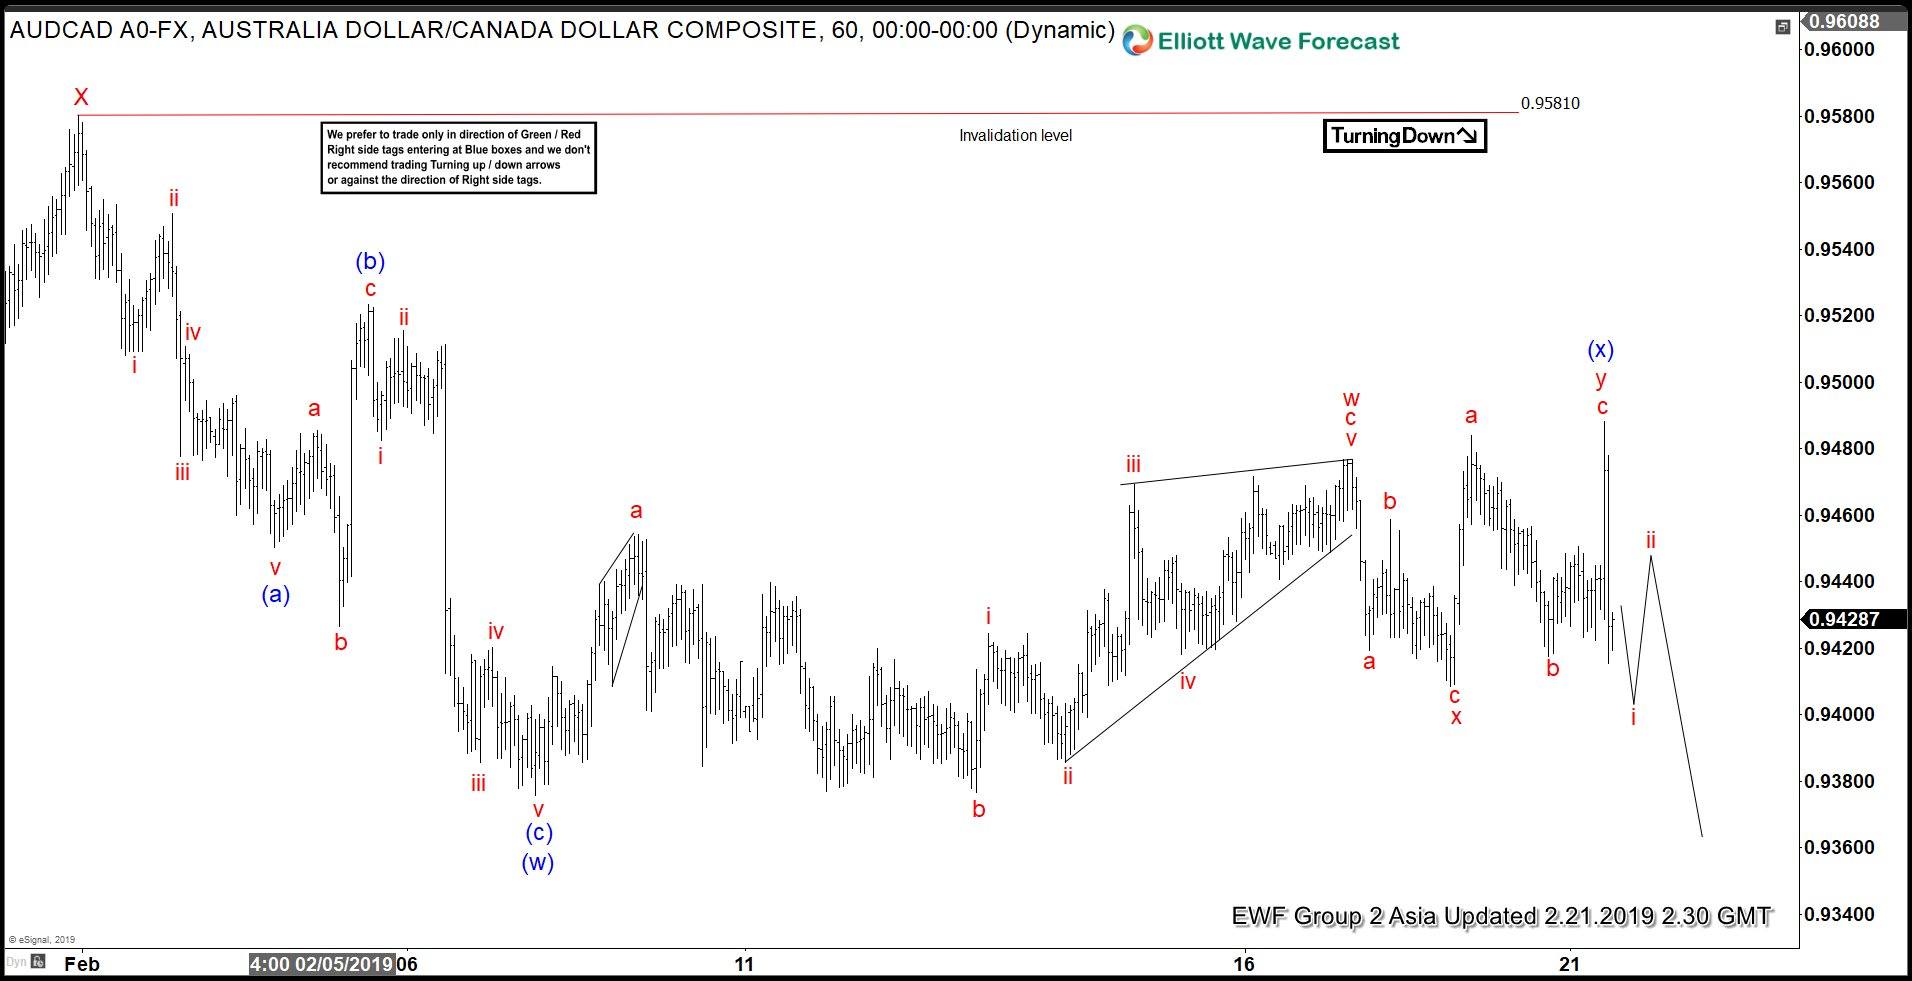
AUDCAD 1 Hour Elliott wave Chart from 2/21/2019 Asia update, in which the pair made the last push higher as expected and ended wave y of (x) at 0.9488 high. Down from there, the pair has made a new low below 0.9375 low confirming the next move lower in wave (y) towards 0.9280-0.9153 100%-161.8% Fibonacci extension area of (w)-(x) before a 3 wave bounce takes place. Near-term, as far as bounces fail below 0.9488 high expect pair to extend lower.
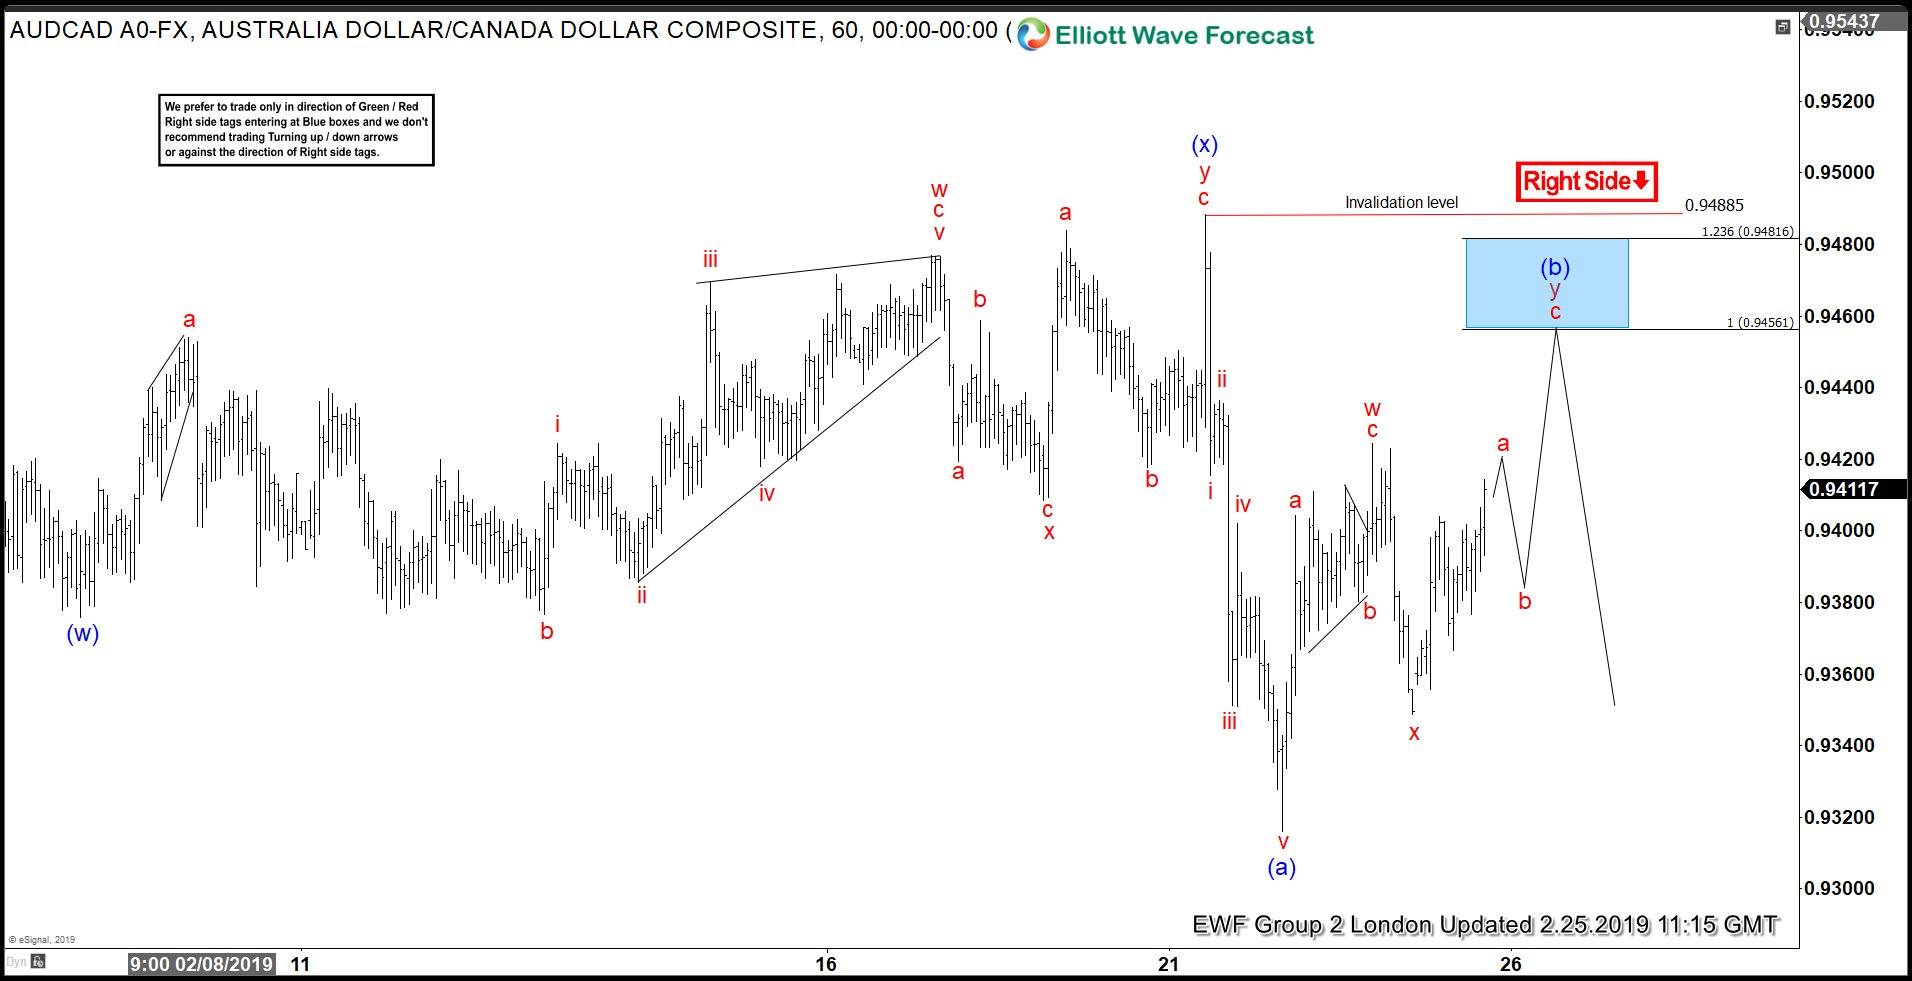
AUDCAD Elliott Wave Latest 1 Hour Chart From 2/25/2019
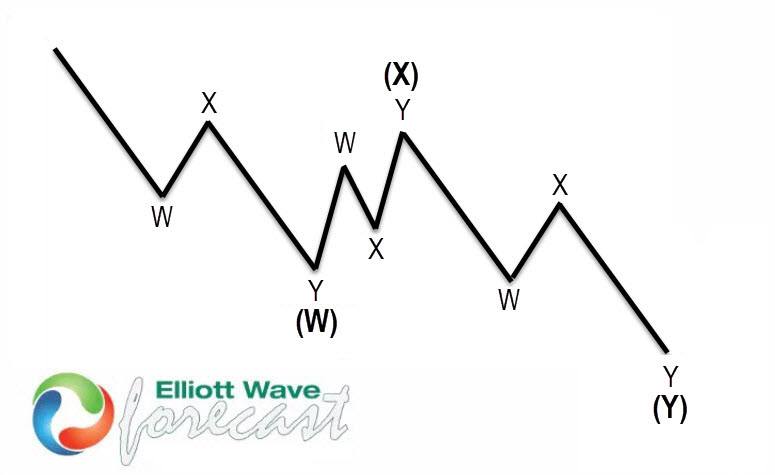
Double three is most common patterns in New Elliott Wave theory is 7 swings structure (double three). We spot it in the market every day in many instruments. It’s a very reliable structure by which we can make a good analysis and what is most important it’s giving us good trading entries with clearly defined invalidation levels and target areas. The picture below presents what Elliott Wave Double Three pattern looks like. It has (W),(X),(Y) labeling and 3,3,3 inner structure, which means all of these 3 legs are corrective sequences. Each (W) and (Y) are made of 3 swings, they’re having W,X,Y structure in a lower degree.