
The EUR/USD currency pair
Technical indicators of the currency pair:
Prev Open: 1.13694
Open: 1.13703
% chg. over the last day: +0.04
Day’s range: 1.13553 – 1.13752
52 wk range: 1.1214 – 1.2557
EUR retreated from the local maximums. The EUR/USD quotes are consolidating around 1.13500 and 1.13800. The demand for the USD returned after the positive GDP report. According to preliminary data, the US economy grew by 2.6% (y\y) which is above the market expectations of 2.3%. The USD is additionally supported by the growth of the US Treasury bonds. The investors are waiting for reports on the US\Beijing negotiations. Right now EUR\USD is in a bearish mood, you should open positions from the key levels.
The Economic News Feed for 28.02.2019:
Industrial PMI (GER) – 10:55 (GMT+2:00);
Labour Market Report (GER) – 10:55 (GMT+2:00);
Consumer Price Index (EU) – 12:00 (GMT+2:00);
ISM Business Activity Index (US) – 17:00 (GMT+2:00);
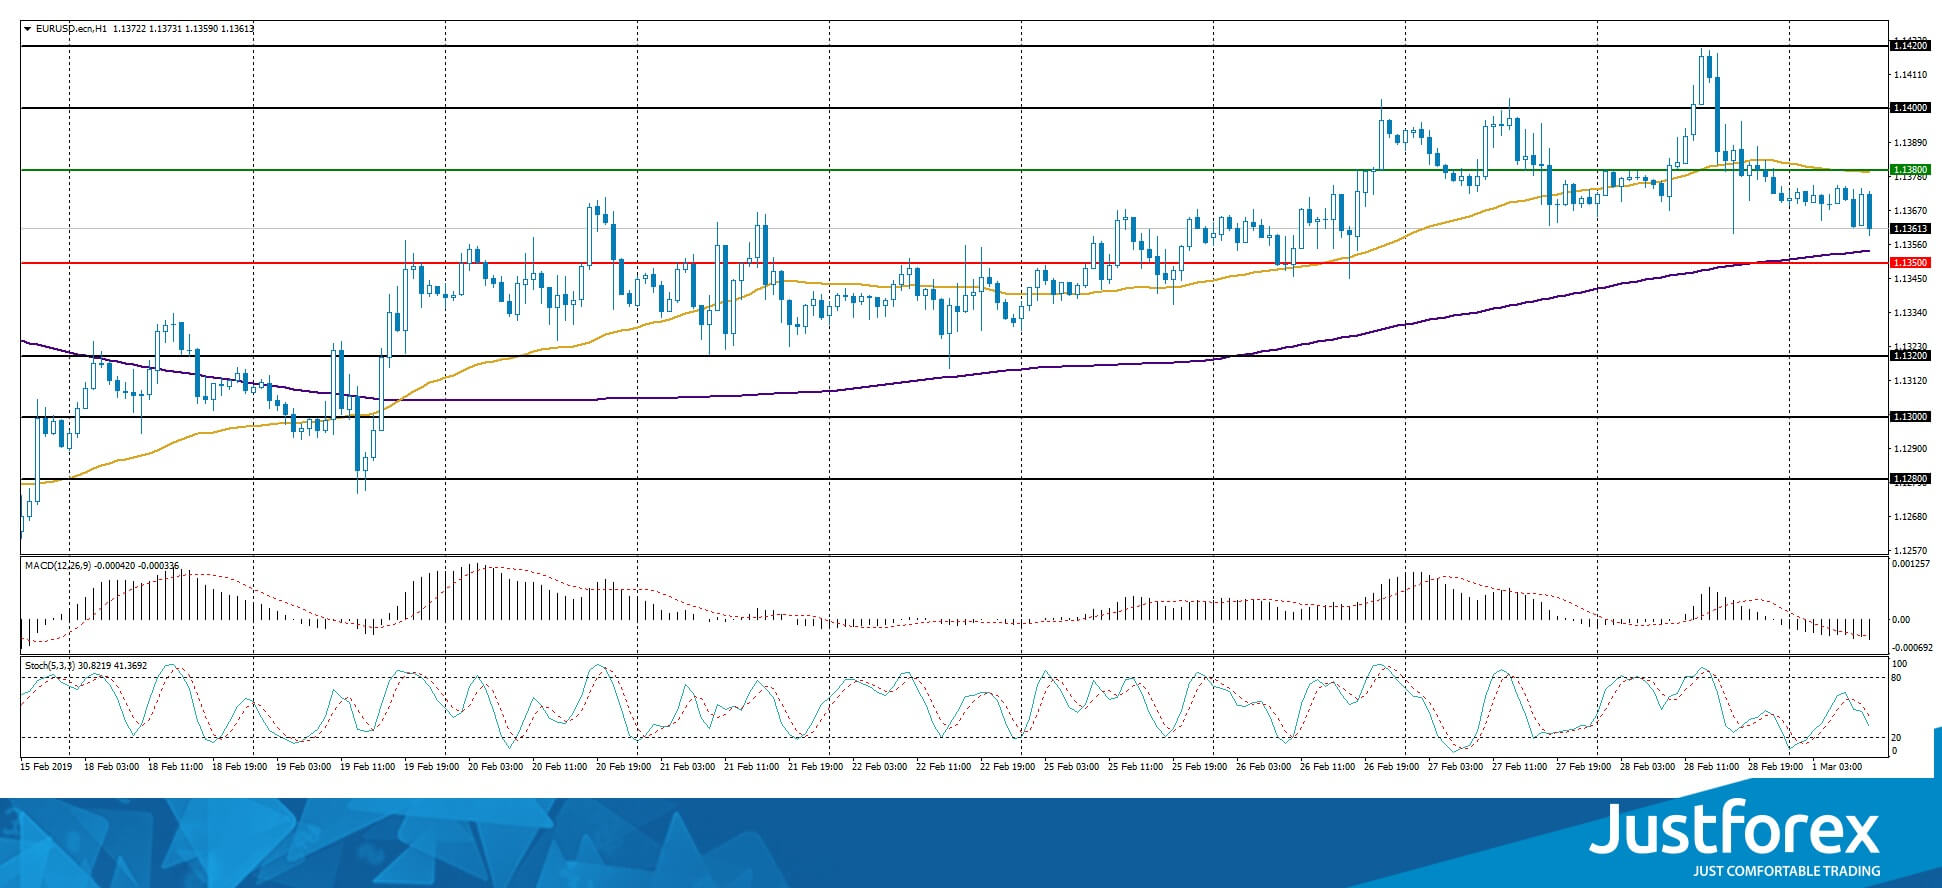
The indicators do not provide precise signals, the price is fixed between 50 MA and 200 MA.
The MACD histogram is in the negative zone and below the signal line, which points to the bearish mood.
The Stochastic Oscillator is in the neutral zone, the %K line is below %D line, which suggests you should sell EUR\USD.
Trading recommendations
Support levels: 1.13500, 1.13200, 1.13000
Resistance levels: 1.13800, 1.14000, 1.14200
If the price fixes below 1.13500, expect the quotes to fall toward 1.13200-1.13000.
Alternatively, the quotes can correct toward 1.14000-1.14200.
The GBP/USD currency pair
Technical indicators of the currency pair:
Prev Open: 1.33068
Open: 1.32614
% chg. over the last day: -0.35
Day’s range: 1.32331 – 1.32662
52 wk range: 1.2438 – 1.4378
GBP/USD retreated from the local maximums. The quotes have now stabilized and are consolidating around 1.32150 and 1.32750. The financial market participants are fixing the positions after the week-long rally. A technical correction is possible soon. You should open positions from these levels.
At 11:30 (GMT+2:00) the UK will publish the industrial PMI.
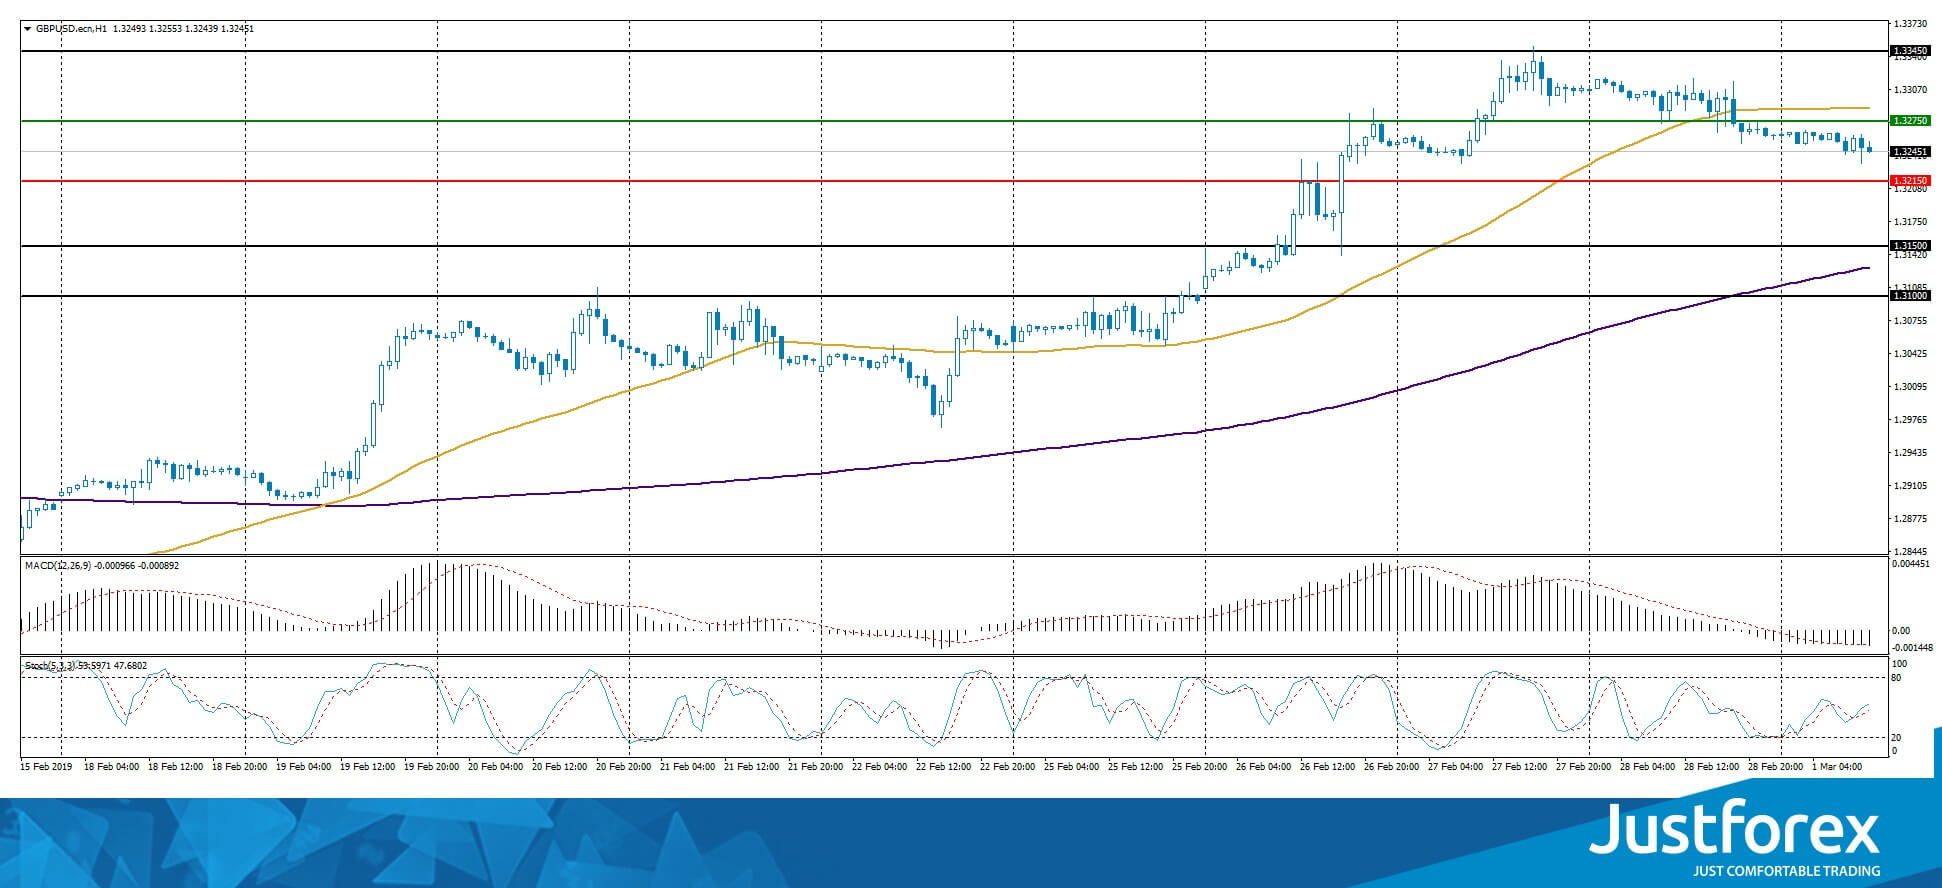
The indicators do not provide precise signals, the price fixed between 50 MA and 200 MA.
The MACD histogram is in the negative zone, and below the signal line, which gives a strong signal to sell GBP/USD.
The Stochastic Oscillator is in the neutral zone, the %K line is above the %D line, which points to the bullish mood.
Trading recommendations
Support levels: 1.32150, 1.31500, 1.31000
Resistance levels: 1.32750, 1.33450, 1.34000
If the price fixes below 1.32150, expect the quotes to grow toward 1.31600-1.31400.
Alternatively, the quotes can correct toward 1.33300-1.33500.
The USD/CAD currency pair
Technical indicators of the currency pair:
Prev Open: 1.31543
Open: 1.31690
% chg. over the last day: +0.04
Day’s range: 1.31320 – 1.31757
52 wk range: 1.2248 – 1.3664
USD/CAD remains in a flat. There is no single defined trend. Right now the quotes are testing the demand zone of 1.31300-1.31150, with the resistance fixing at 1.31700. The quotes can descend further due to positive oil quotes dynamics. The investors are waiting for important reports from Canada. You should open positions from the key levels.
At 15:30 (GMT+2:00) Canada will publish a GDP report.
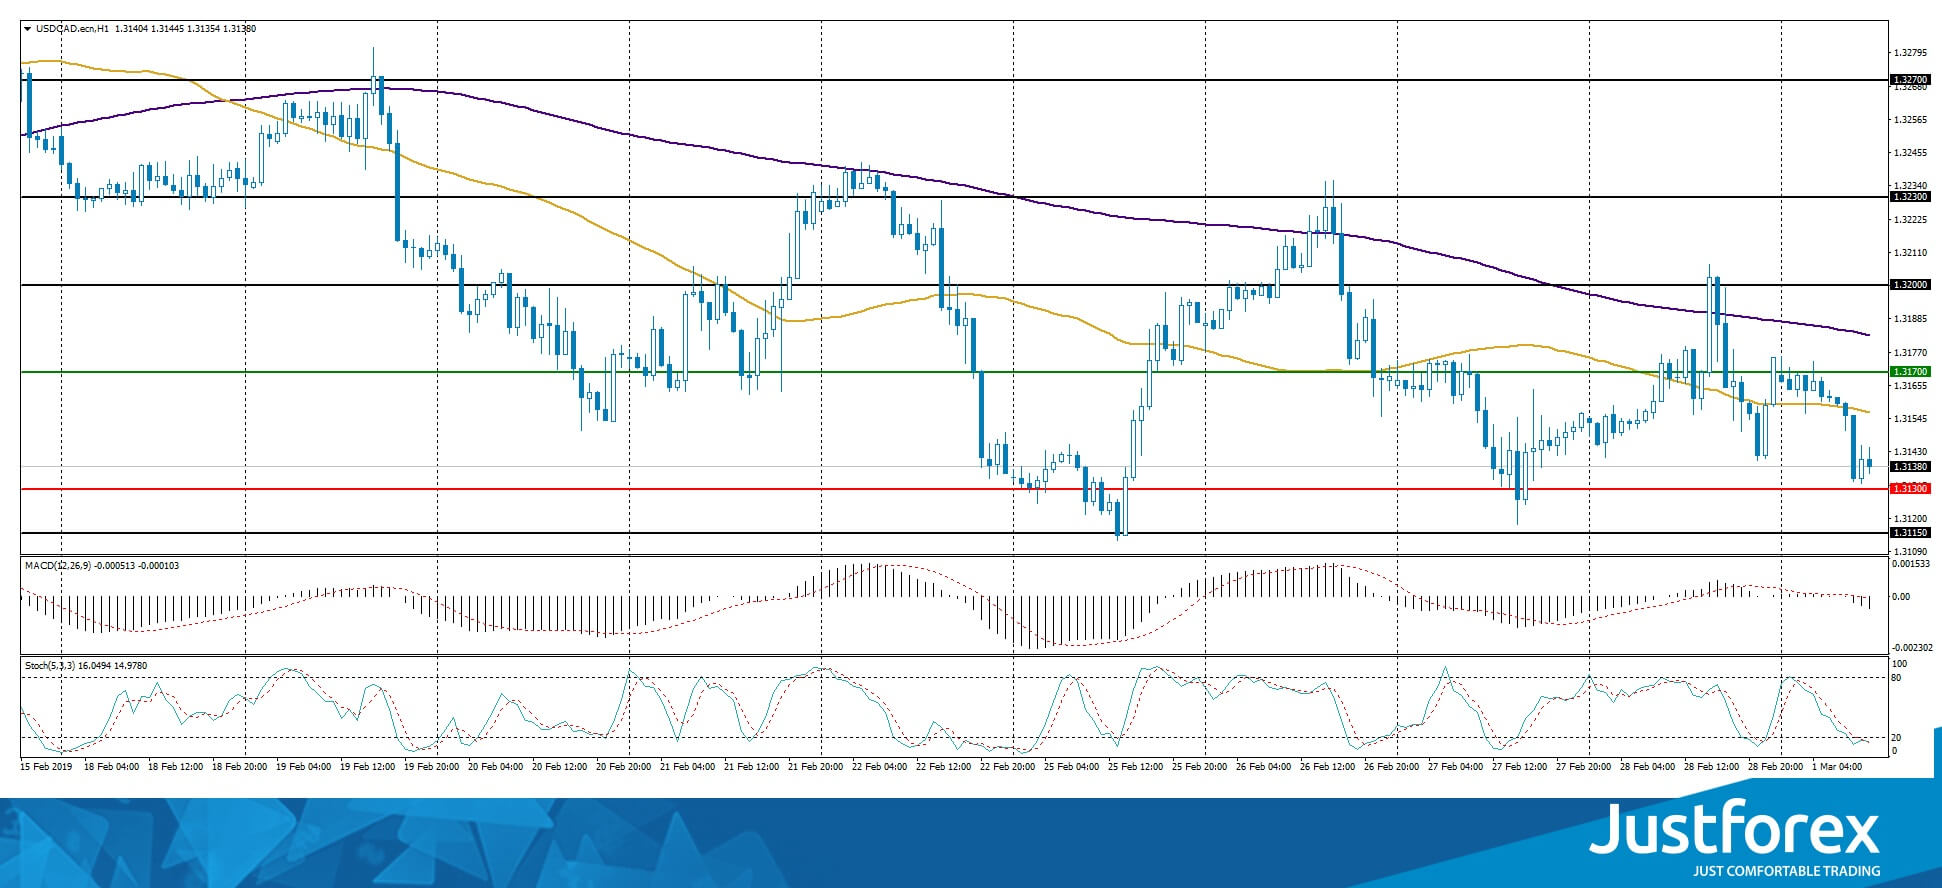
The price fixed below 50 MA and 200 MA which points to the power of the buyers.
The MACD histogram is in the negative zone, which gives a signal to sell USD/CAD.
The Stochastic Oscillator is in the oversold zone, the %K line is crossing the %D line. There are no signals at the moment.
Trading recommendations
Support levels: 1.31300, 1.31150, 1.30850
Resistance levels: 1.31700, 1.32000, 1.32300
If the price fixes below 1.31300, expect the quotes to fall toward 1.31000-1.30850.
Alternatively, the quotes can grow toward 1.32000.
The USD/JPY currency pair
Technical indicators of the currency pair:
Prev Open: 110.984
Open: 111.375
% chg. over the last day: +0.33
Day’s range: 111.324 – 111.983
52 wk range: 104.56 – 114.56
USD\JPY is in an aggressive buyout. During the last two days of trading, yen weakened against the USD by more than 100 points and the quotes updated te 10-month maximums. The demand on USD grew after the positive GDP report, as well as the growth of the US Treasury bonds. Right now the key range is 111.650-112.000. You should open positions from these levels.
The News Feed on Japan is calm.
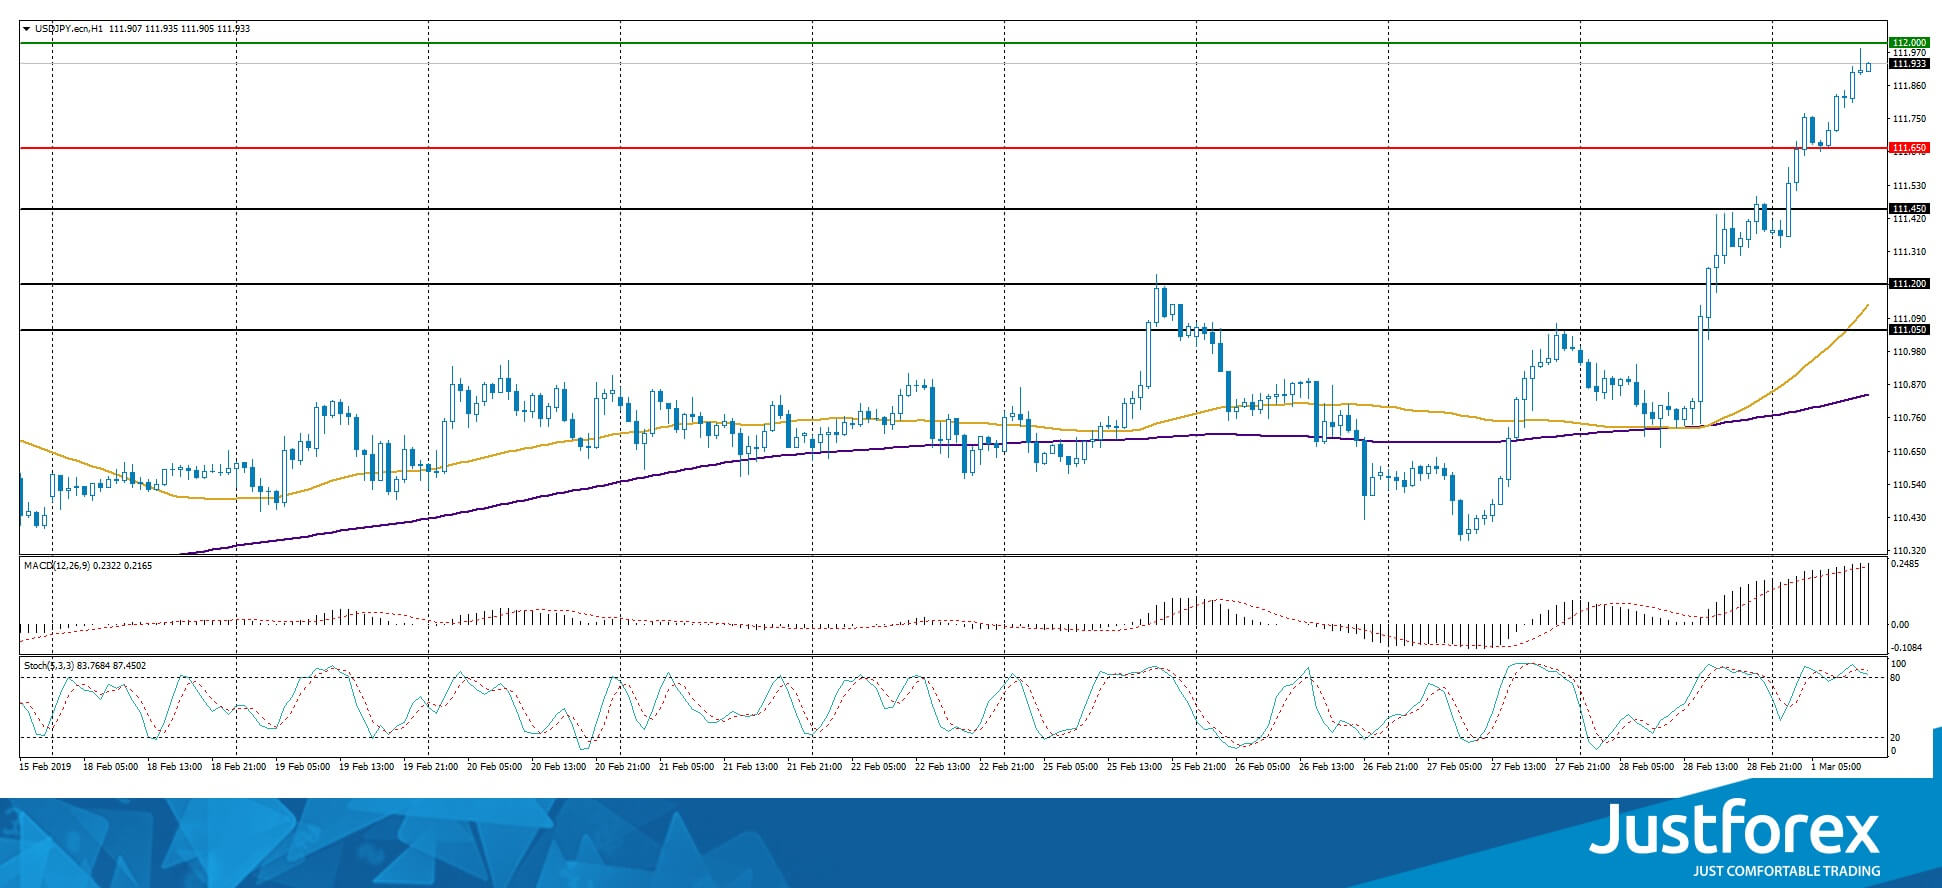
The price fixed above 50 MA and 200 MA which points to the power of the buyers.
The MACD histogram is in the positive zone but above the signal line, which gives a weak signal to buy USD/JPY.
The Stochastic Oscillator is in the overbought zone, the %K line is crossing the %D line, which does not provide any signals.
Trading recommendations
Support levels: 111.650, 111.450, 111.200
Resistance levels: 112.000, 112.500
If the price fixes below 112.000, expect the quotes to grow toward 112.400-112.600.
Alternatively, the quotes can correct toward 111.500-111.300.


