
The EUR/USD currency pair
Technical indicators of the currency pair:
Prev Open: 1.13255
Open: 1.13362
% chg. over the last day: +0.14
Day’s range: 1.13336 – 1.13544
52 wk range: 1.1214 – 1.2557
The USD index holds the two-week minimums before the Federal Reserve meeting. The financial market participants are waiting for the regulator to approve a “careful” approach towards hardening the monetary policy. Right now the currency pair is moving in a flat. The key support and resistance levels are 1.13250 and 1.13600. EUR has further growth prospects. You should open positions from the key levels.
At 12:00 (GMT+2:00) ZEW will publish the economic mood index in Germany.
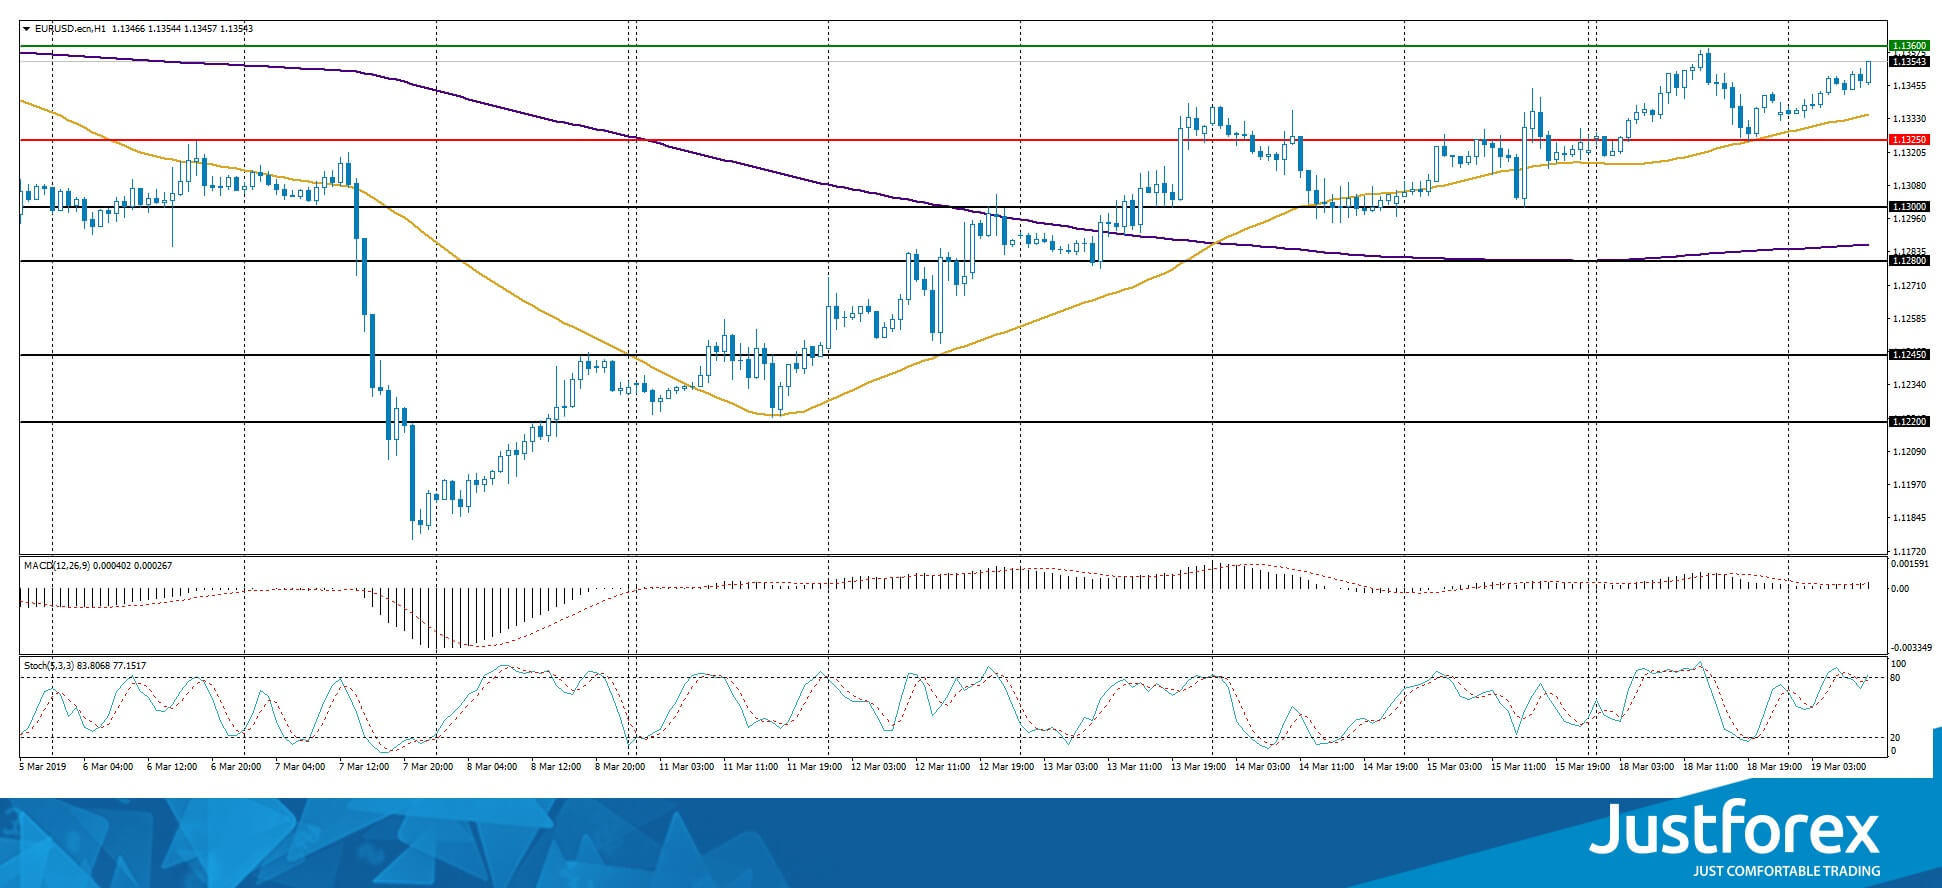
The price fixed above 50 MA and 200 MA which points to the power of the buyers.
The MACD histogram is in the positive zone and keeps rising, which gives a signal to buy EUR/USD.
The Stochastic Oscillator is in the overbought zone, the %K line is crossing the %D line. There are no signals at the moment.
Trading recommendations
Support levels: 1.13250, 1.13000, 1.12800
Resistance levels: 1.13600, 1.14000
If the price fixes above the local resistance of 1.13600, expect the quotes to grow toward 1.14000.
Alternatively, the quotes can descend toward 1.13000-1.12800.
The GBP/USD currency pair
Technical indicators of the currency pair:
Prev Open: 1.32955
Open: 1.32466
% chg. over the last day: -0.24
Day’s range: 1.32431 – 1.32806
52 wk range: 1.2438 – 1.4378
GBP/USD keeps trading in a flat. The key levels are 1.12400 and 1.33000. The investors are waiting for new data regarding Brexit. The GBP is under pressure after John Bercow refused to approve a new Brexit vote. The official stated that the deal should be presented in a different format. You should open positions from the key levels.
At 11:30 (GMT+2:00) the UK will publish a labour market report.
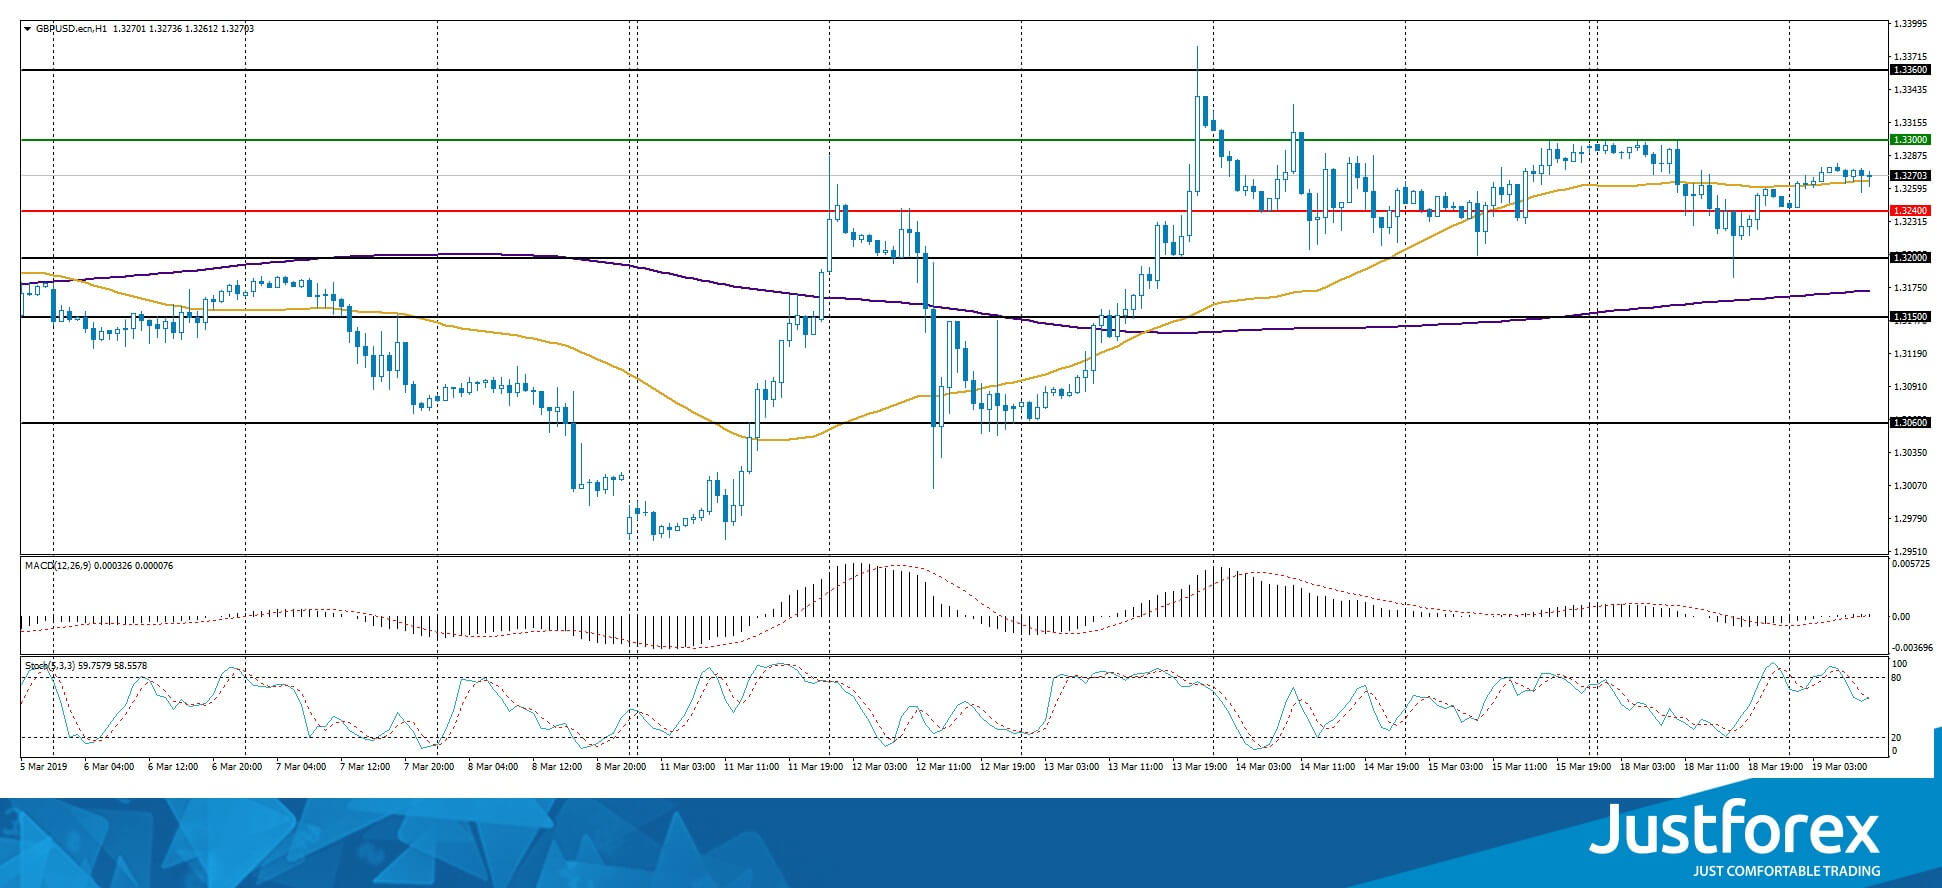
The indicators do not provide precise signals, the price has crossed 50 MA.
The MACD histogram is close to 0.
The Stochastic Oscillator is in the neutral zone, the %K line is crossing the %D line. There are no signals at the moment.
Trading recommendations
Support levels: 1.32400, 1.32000,1.31500
Resistance levels: 1.33000, 1.33600
If the price fixes above 1.33000, expect the quotes to rise toward 1.33500-1.33700.
Alternatively, the quotes can fall toward 1.32000-1.31500.
This article reflects a personal opinion and should not be interpreted as an investment advice, and/or offer, and/or a persistent request for carrying out financial transactions, and/or a guarantee, and/or a forecast of future events.
The USD/CAD currency pair
Technical indicators of the currency pair:
Prev Open: 1.33316
Open: 1.33375
% chg. over the last day: -0.09
Day’s range: 1.33224 – 1.33441
52 wk range: 1.2248 – 1.3664
USD/CAD keeps trading in a flat. The technical picture is ambiguous. Right now the local support and resistance levels are 1.33100 and 1.33400. The demand for USD is weakened before the Federal Reserve meeting. Additional support for CAD is caused by the bullish oil market. The quotes have a tendency to descend. You should open positions from the key levels.
The Economic News Feed for 19.03.2019 is calm.
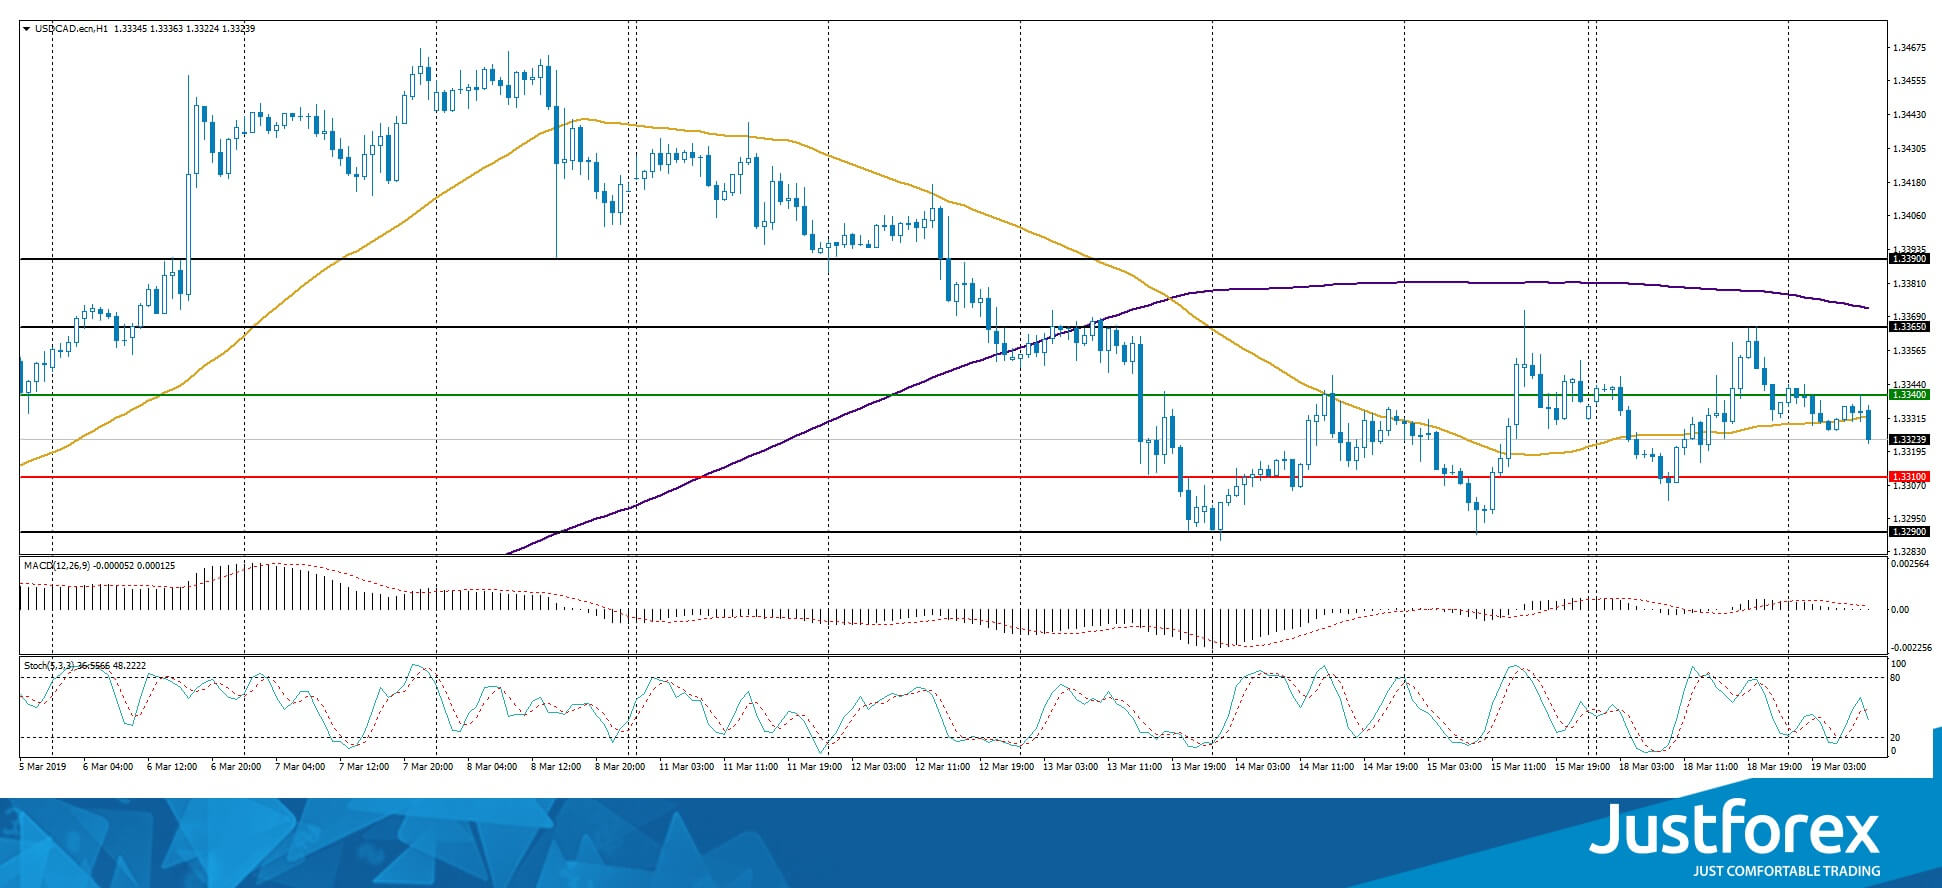
The indicators do not provide precise signals, the price has crossed 50 MA.
The MACD histogram is close to 0.
The Stochastic Oscillator is in the neutral zone, the %K line is crossing the %D line. There are no signals at the moment.
Trading recommendations
Support levels: 1.33100, 1.32900, 1.32500
Resistance levels: 1.33400, 1.33650, 1.33900
If the price fixes below 1.33100, expect the quotes to fall toward 1.32800-1.32600.
Alternatively, the quotes can grow toward 1.33650-1.33900.
The USD/JPY currency pair
Technical indicators of the currency pair:
Prev Open: 111.466
Open: 111.443
% chg. over the last day: -0.15
Day’s range: 111.158 – 111.443
52 wk range: 104.56 – 114.56
USD/JPY started to descend. The trading instrument updated the local miniums. Right now the quotes are consolidating. The local support and resistance levels are 111.150 and 111.400. The demand for USD is weakening. You should keep an eye on the US Treasury bonds` yield dynamics and open positions from the key levels.
The Economic News Feed for 19.03.2019 is calm.
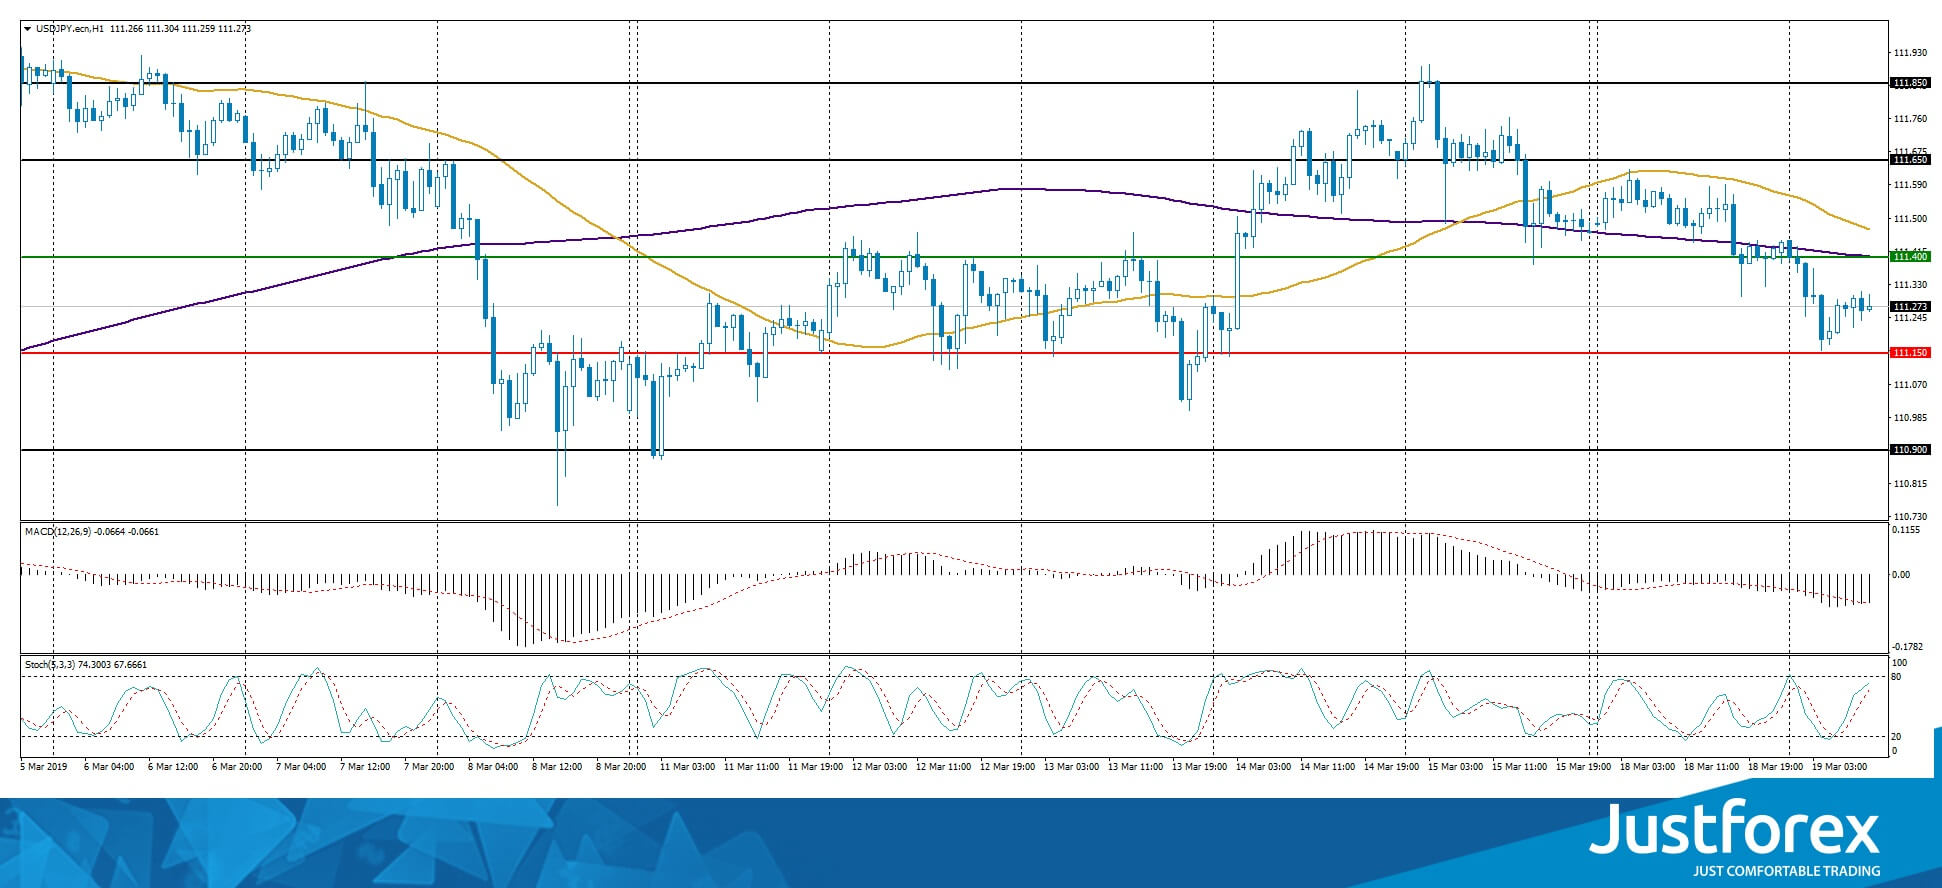
The indicators do not provide precise signals, 50 MA started to cross 200 MA.
The MACD histogram is in the negative zone but above the signal line, which gives a weak signal to sell USD/JPY.
The Stochastic Oscillator is in the neutral zone, the %K line is above the %D line which points towards the bullish mood.
Trading recommendations
Support levels: 111.150, 111.900, 110.600
Resistance levels: 111.400, 111.650, 111.850
If the price fixes below the local support 111.150, expect the quotes to fall toward 110.900-110.700.
Alternatively, the quotes can grow toward 111.600-111.800.


