
The EUR/USD currency pair
Technical indicators of the currency pair:
Prev Open: 1.13362
Open: 1.13506
% chg. over the last day: +0.15
Day’s range: 1.13355 – 1.13570
52 wk range: 1.1214 – 1.2557
EUR/USD keeps consolidating. The financial market participants are waiting for the Federal Reserve’s decision regarding the key interest rate, as well as updated FOMC forecasts. The majority of experts conclude that the FRS will keep the key interest rate around 2.25%-2.50% and will keep using a careful approach toward hardening the monetary policy. Right now the key trading range is 1.13250-1.13600. You should open positions from these levels.
At 20:00 (GMT+2:00), the Federal Reserve will decide on the key interest rate.
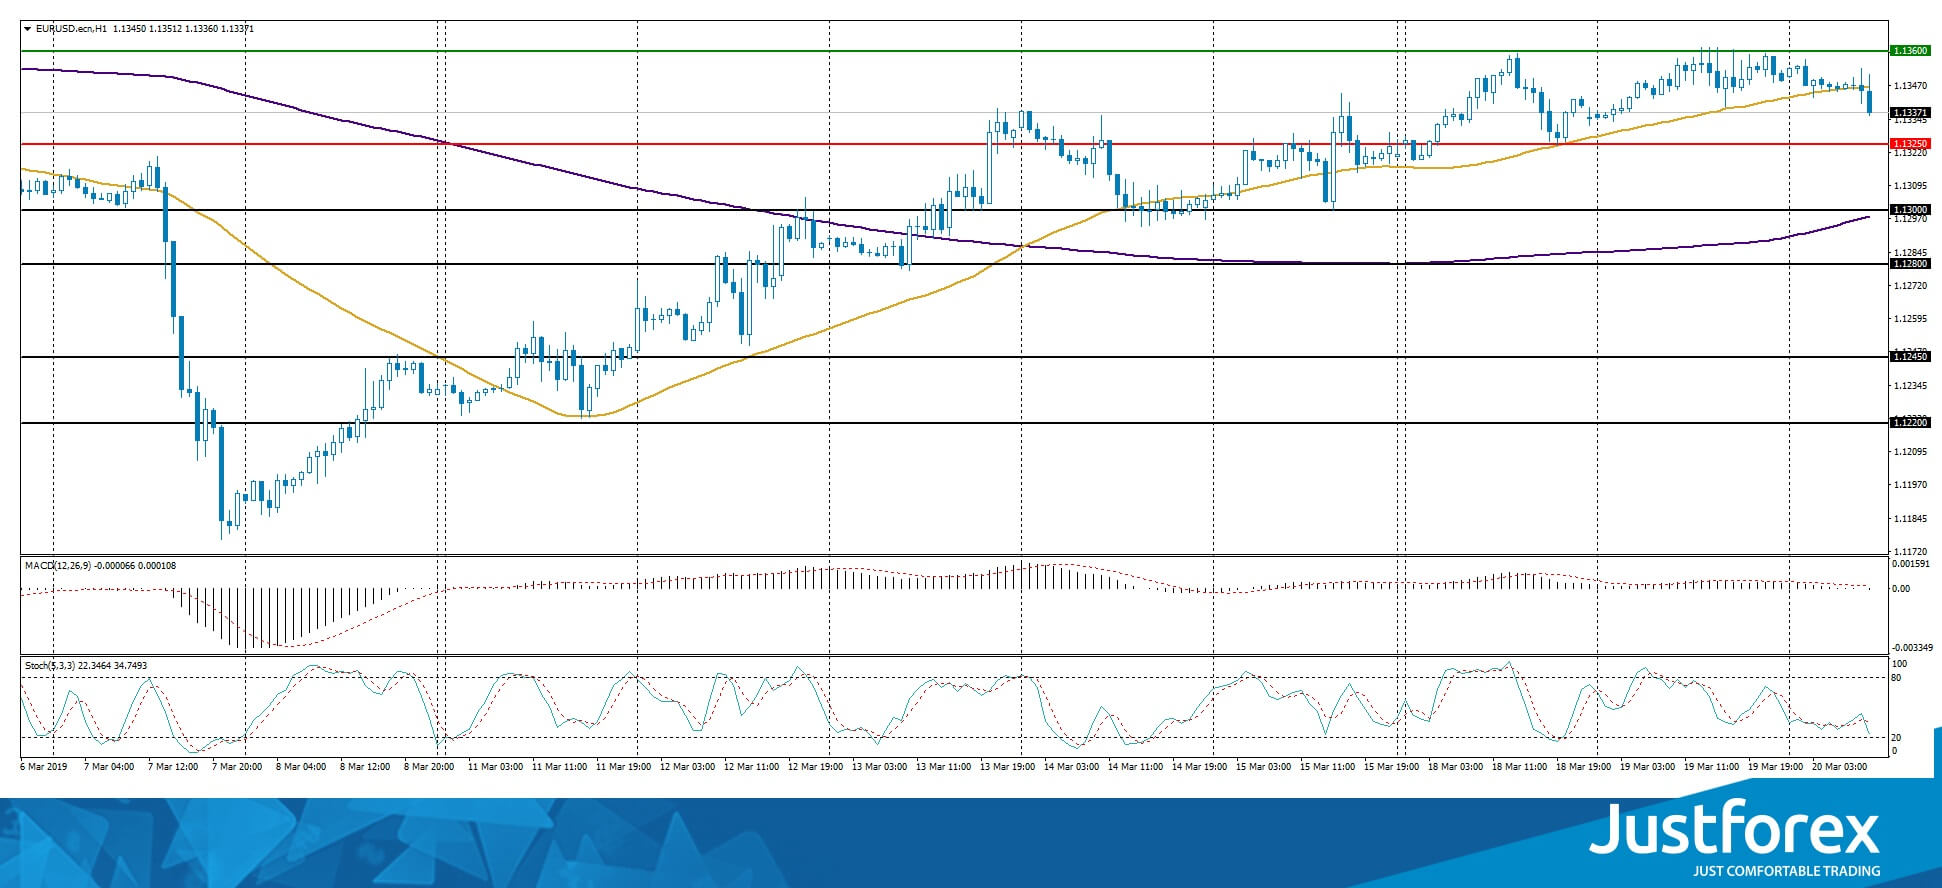
The indicators do not provide precise signals, the price has crossed 50 MA.
The MACD histogram is close to 0.
The Stochastic Oscillator is in the neutral zone, the %K line is crossing the %D line. There are no signals at the moment.
Trading recommendations
Support levels: 1.13250, 1.13000, 1.12800
Resistance levels: 1.13250, 1.13000, 1.12800
If the price fixes above the 1.13600, expect the quotes to grow toward 1.14000.
Alternatively, the quotes can descend toward 1.13000-1.12700.
The GBP/USD currency pair
Technical indicators of the currency pair:
Prev Open: 1.32466
Open: 1.32668
% chg. over the last day: +0.09
Day’s range: 1.32125 – 1.32753
52 wk range: 1.2438 – 1.4378
The GBP/USD technical picture remains ambiguous. Yesterday the National Statistic Service published mixed labour market reports. The investors are waiting for new intel regarding Brexit. The local support and resistance levels are 1.32000 and 1.32600. You should open positions from these levels.
At 11:30 (GMT+2:00) the UK will publish a consumer price index.
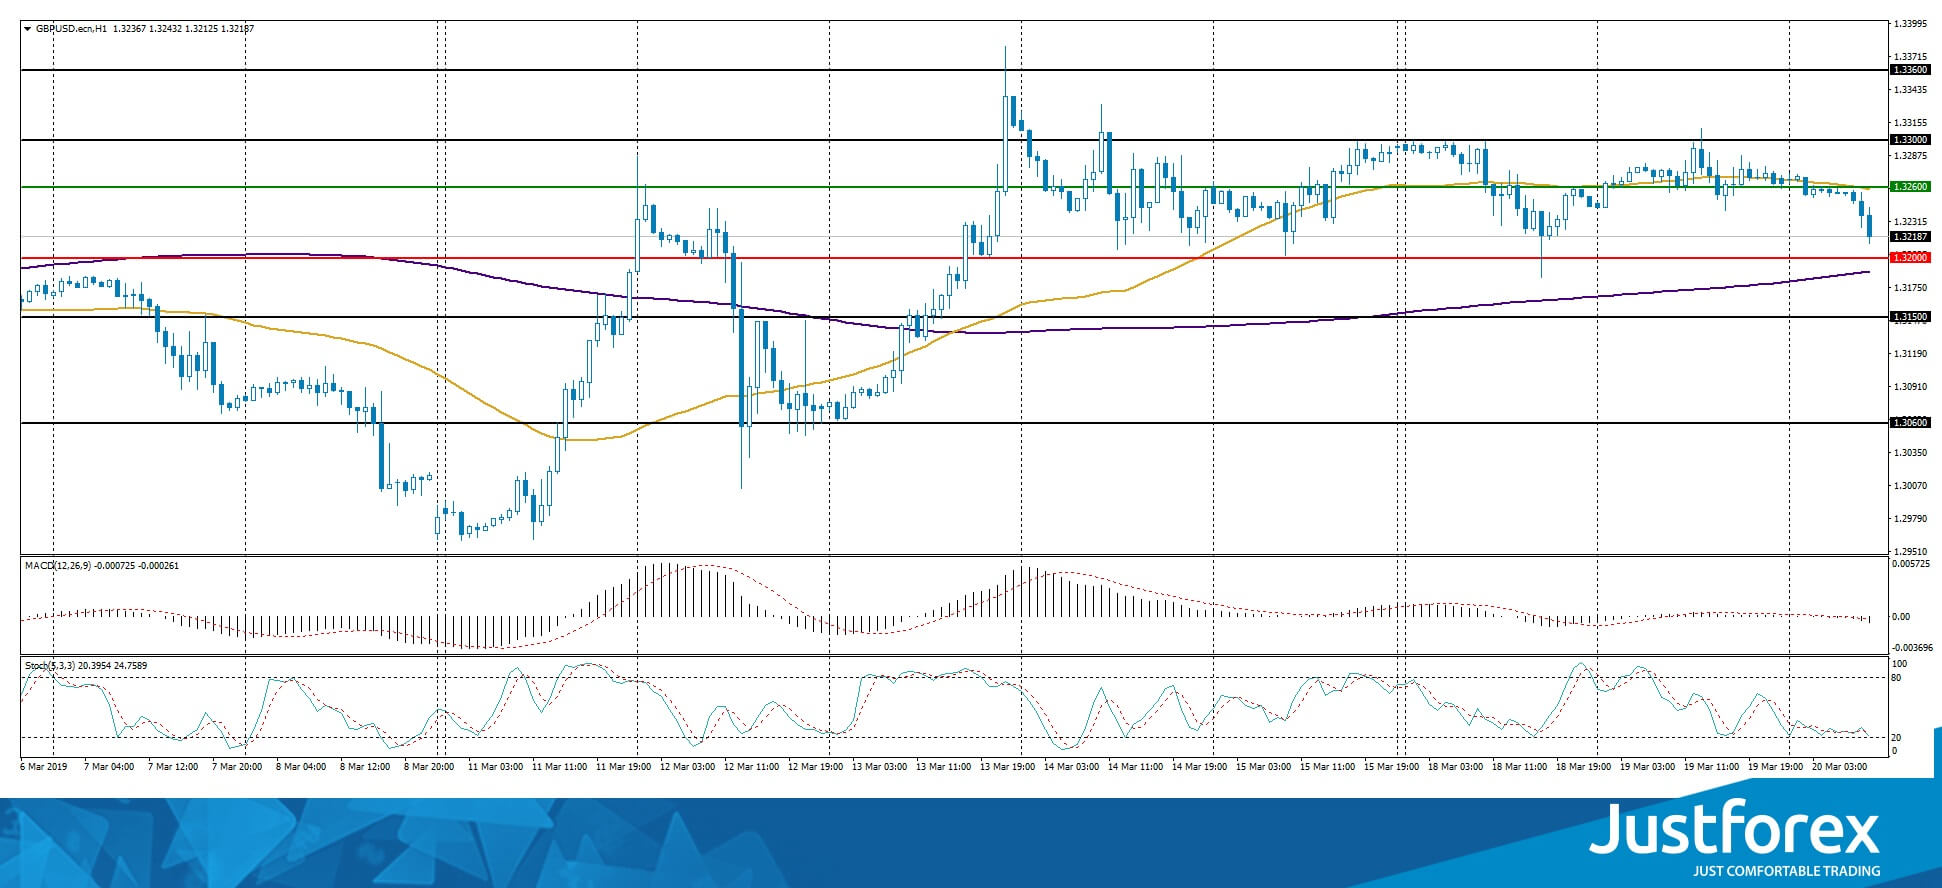
The indicators do not provide precise signals, the price fixed betwee 50 MA and 200 MA.
The MACD histogram started to descend, which points to the power of the sellers.
The Stochastic Oscillator is close to the oversold zone, the %K line is crossing the %D line. There are no signals at the moment.
Trading recommendations
Support levels: 1.32000,1.31500, 1.30600
Resistance levels: 1.32600, 1.33000, 1.33600
If the price fixes below the 1.32000, expect the quotes to fall toward 1.31500-1.31300.
Alternatively, the quotes can rise toward 1.33000-1.33500.
This article reflects a personal opinion and should not be interpreted as an investment advice, and/or offer, and/or a persistent request for carrying out financial transactions, and/or a guarantee, and/or a forecast of future events.
The USD/CAD currency pair
Technical indicators of the currency pair:
Prev Open: 1.33375
Open: 1.33246
% chg. over the last day: -0.10
Day’s range: 1.33193 – 1.33455
52 wk range: 1.2248 – 1.3664
USD/CAD was very active yesterday but didn’t have a definitive trend. Right now the quotes are testing the local resistance at 1.33450. The nearest support is at 1.33150. The financial market participants are waiting for the Federal Reserve’s meeting. You should keep an eye on the oil quotes dynamics and open positions from the key levels.
The Economic News Feed for 20.03.2019 is calm.
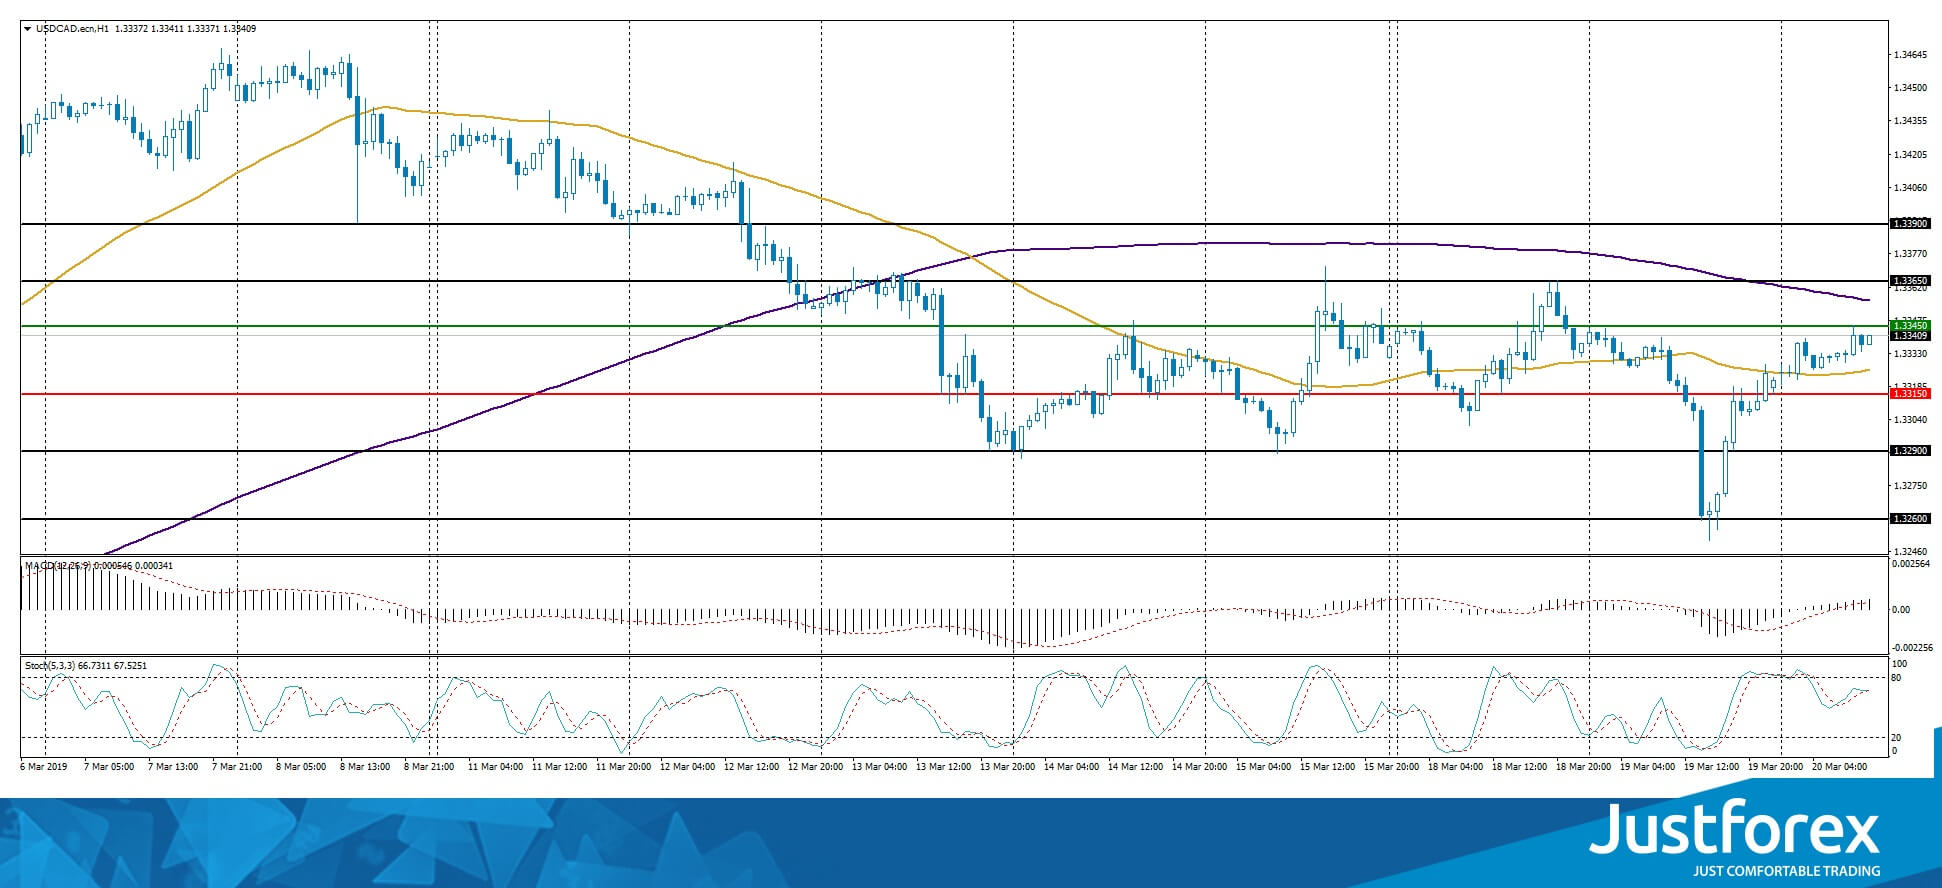
The indicators do not provide precise signals, the price fixed between 50 MA and 200 MA.
The MACD histogram is in the positive zone, which points towards the bullish mood.
The Stochastic Oscillator is in the neutral zone, the %K line is crossing the %D line. There are no signals at the moment.
Trading recommendations
Support levels: 1.33150, 1.32900, 1.32600
Resistance levels: 1.33450, 1.33650, 1.33900
If the price fixes below 1.33150, expect the quotes to fall toward 1.32800-1.32600.
Alternatively, the quotes can grow toward 1.33700-1.34000.
The USD/JPY currency pair
Technical indicators of the currency pair:
Prev Open: 111.443
Open: 111.398
% chg. over the last day: -0.02
Day’s range: 111.360 – 111.695
52 wk range: 104.56 – 114.56
USD/JPY shows an ambiguous technical picture. The trading instrument keeps trading in a long flat. Right now the quotes are consolidating. The local support and resistance levels are 111.400 and 111.650. The investors are waiting for the Federal Reserve meeting regarding the key interest rate. You should open positions from the key levels.
The Economic News Feed for 20.03.2019 is calm.
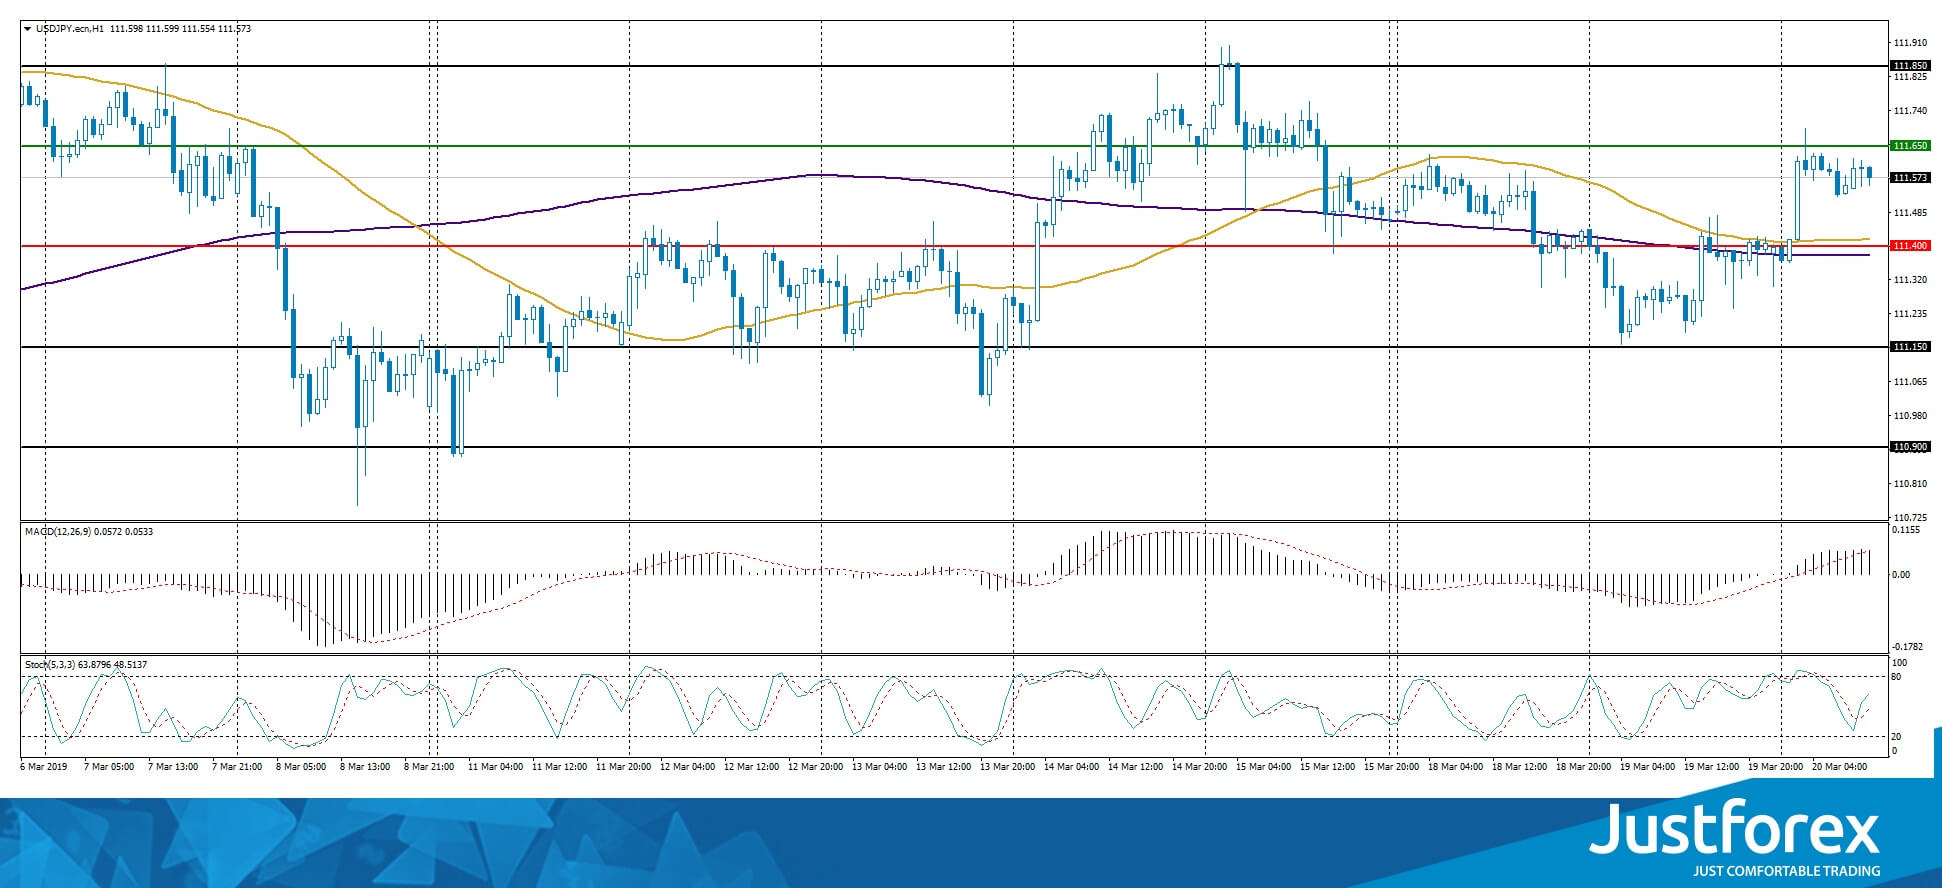
The indicators do not provide precise signals: 50 MA started to cross 200 MA.
The MACD histogram is in the positive zone and above the signal line, which gives a strong signal to buy USD/JPY.
The Stochastic Oscillator is in the neutral zone, the %K line is above the %D line, which points toward the bullish mood.
Trading recommendations
Support levels: 111.400, 111.150, 110.900
Resistance levels: 111.650, 111.850, 112.000
If the price fixes below the 111.400 local support, expect the quotes to fall toward 111.000.
Alternatively, the quotes can frow toward 111.850-112.000.


