
Key Highlights
- The US Dollar corrected lower this week and recently rebounded above 111.50 against the Japanese Yen.
- A major bullish trend line is formed with support at 111.10 on the 4-hours chart of USD/JPY.
- The US Initial Jobless Claims for the week ending April 06, 2019 declined to 196K.
- The Michigan Consumer Sentiment Index in April 2019 (Prelim) might drop from 98.4 to 98.0.
USDJPY Technical Analysis
This past week, the US Dollar revisited the 111.80-112.00 resistance area and later declined against the Japanese Yen. The USD/JPY pair tested the 110.85 level, recovered recently, and now it is testing the 111.80-112.00 resistance area.
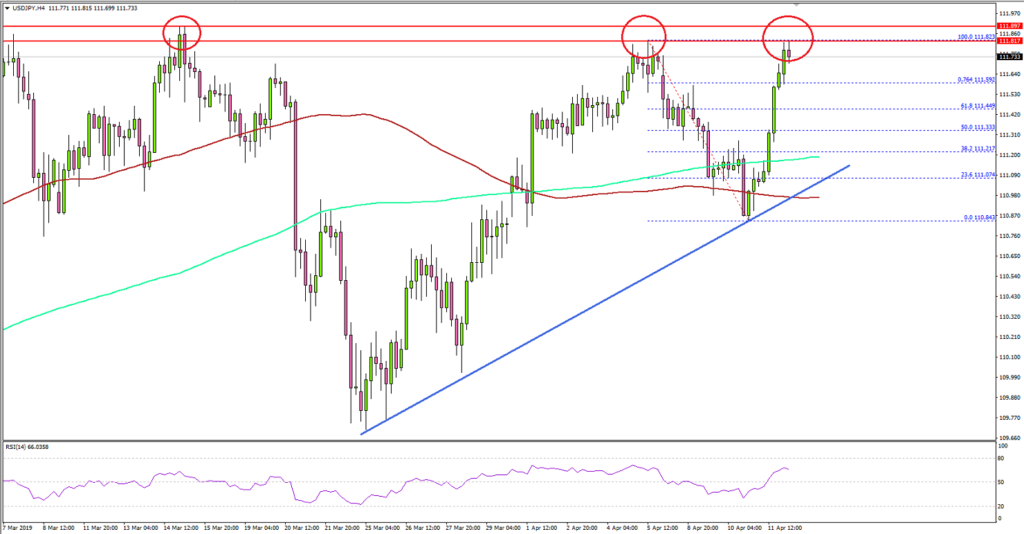
Looking at the 4-hours chart, the pair traded as low as 110.84 and corrected above the 111.00 level. There was a break above the 111.20 resistance, the 100 simple moving average (4-hours, red), and the 200 simple moving average (4-hours, green).
The pair surpassed the 50% Fib retracement level of the last decline from the 111.82 high to 110.84 low. Therefore, there are chances of more gains above the 111.80 level.
An immediate resistance was surpassed at 111.60 and the 76.4% Fib retracement level of the last decline from the 111.82 high to 110.84 low. The pair is now testing the key 111.80 and 112.00 resistance levels, where sellers protecting gains.
On the downside, an initial support is at 111.20. There is also a major bullish trend line formed with support at 111.10 on the same chart. Therefore, it seems like dips remain supported near 111.20 and the pair could retest the key 112.00 resistance area in the near term. If bulls manage to clear the 112.00 resistance this time, the pair could rally significantly.
Fundamentally, the US Initial Jobless Claims report for the week ending April 06, 2019 was released by the US Department of Labor. The market was looking for a rise in claims from the last reading of 202K to 211K.
The actual result was better than the forecast, as the US Initial Jobless Claims declined to 196K. However, the last reading was revised up from 202K to 204K.
The report added that:
The 4-week moving average was 207,000, a decrease of 7,000 from the previous week’s revised average. This is the lowest level for this average since December 6, 1969 when it was 204,500.
Overall, the current trend is positive and USD/JPY could continue higher towards 112.00. However, it won’t be easy for bulls to gain strength above 112.00 in the short term and there could be another bearish reaction.
Economic Releases to Watch Today
- US Import Price Index March 2019 (MoM) – Forecast +0.4%, versus +0.6% previous.
- US Export Price Index March 2019 (MoM) – Forecast +0.2%, versus +0.6% previous.
- Michigan Consumer Sentiment Index April 2019 (Prelim) – Forecast 98.0, versus 98.4 previous.


