
The EUR/USD currency pair
Technical indicators of the currency pair:
Prev Open: 1.12519
Open: 1.13032
% chg. over the last day: +0.44
Day’s range: 1.12990 – 1.13157
52 wk range: 1.1214 – 1.2557
EUR/USD keeps showing a positive trend. Right now the EUR is consolidating around 1.13000. The demand for the risky assets remains relatively high. The local support and resistance levels are 1.12900 and 1.13200. The EUR/USD quotes have a tendency to grow further. You should open positions from the key levels.
This week will have some important releases which may affect the dynamics of the currency majors. The financial market participants also await for more data regarding Brexit and the US/China negotiations. On Friday the world trade platforms will be closed due to Good Friday.
The Economic News Feed for 15.04.2019 is calm.
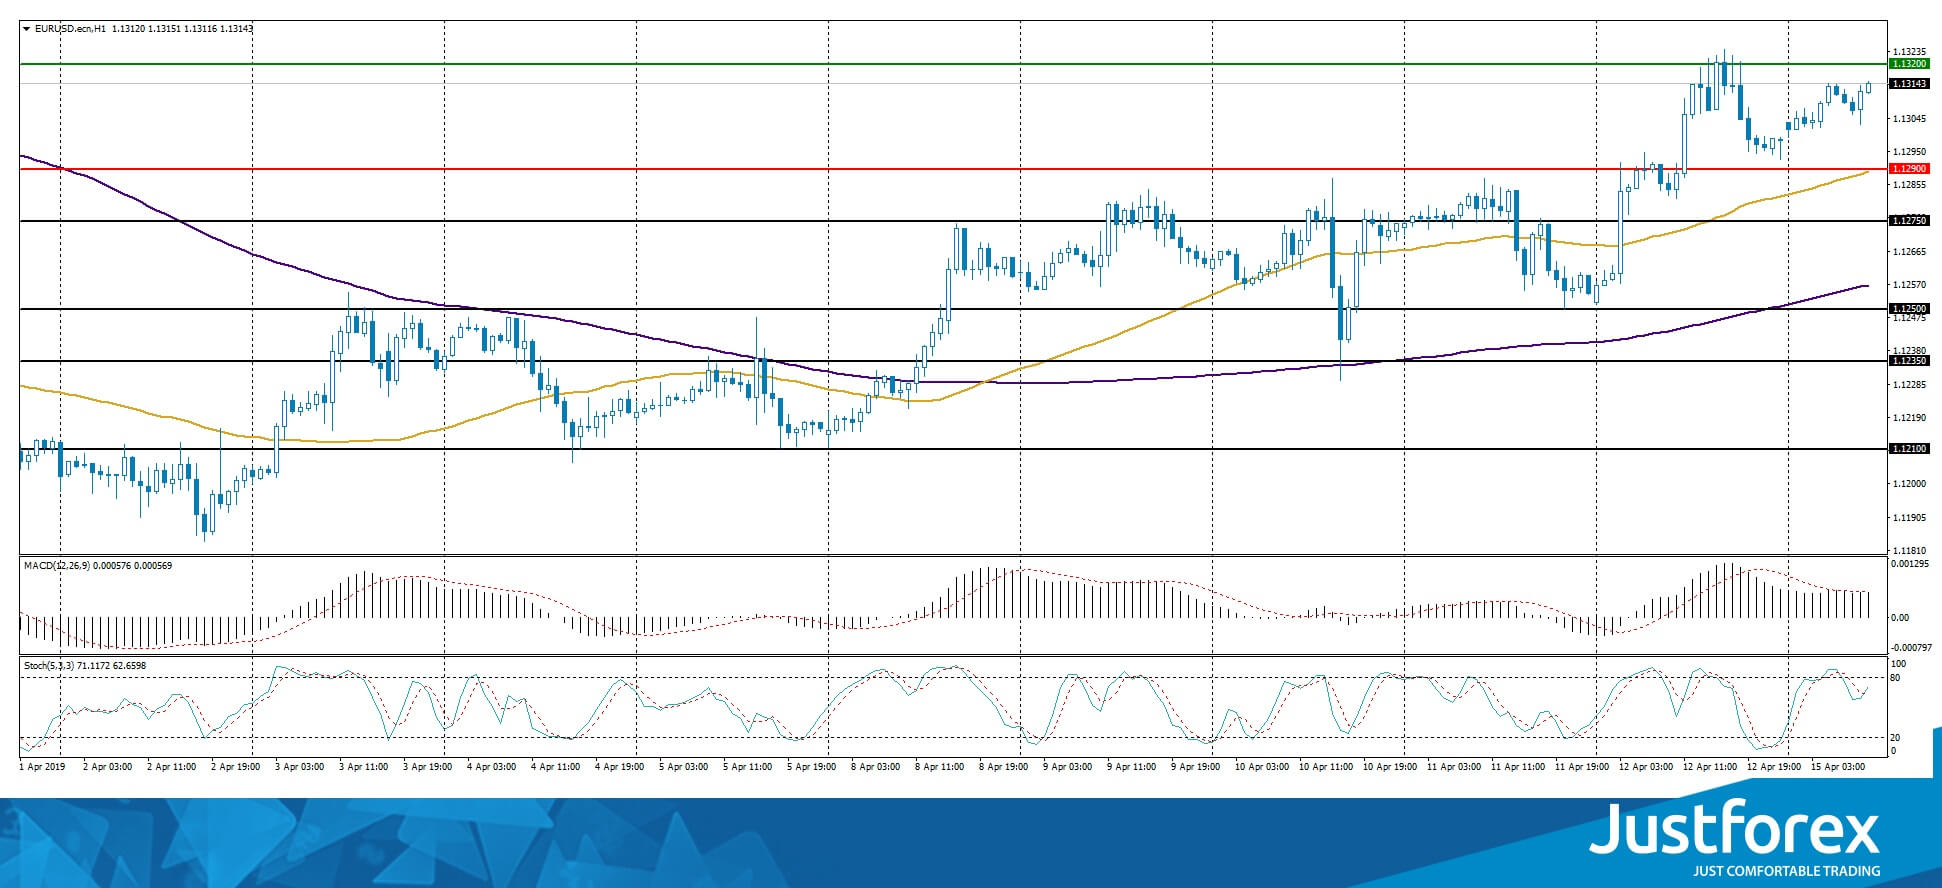
The price fixed above 50 MA and 200 MA which points to the power of the buyers.
The MACD histogram is in the positive zone and keeps rising, which points towards further growth of EUR/USD.
The Stochastic Oscillator is in the neutral zone, the %K line is crossing the %D line. There are no signals at the moment.
Trading recommendations
Support levels: 1.12900, 1.12750, 1.12500
Resistance levels: 1.13200, 1.13500, 1.14000
If the price fixes above 1.13200, expect the quotes to grow toward 1.13500-1.13800.
Alternatively, the quotes can fall toward 1.12700-1.12500.
The GBP/USD currency pair
Technical indicators of the currency pair:
Prev Open: 1.30526
Open: 1.30722
% chg. over the last day: +0.21
Day’s range: 1.30673 – 1.31026
52 wk range: 1.2438 – 1.4378
GBP/USD keeps trading in a long flat. There is no defined trend. The investors are waiting for new info regarding Brexit. The EU postponed it last week, but the market participants are worried that Theresa May still won’t be able to get an approval from the British lawmakers. Right now the local support and resistance are at 1.30650 and 1.31000 respectively. You should open positions from these levels.
The Economic News Feed for 15.04.2019 is calm.
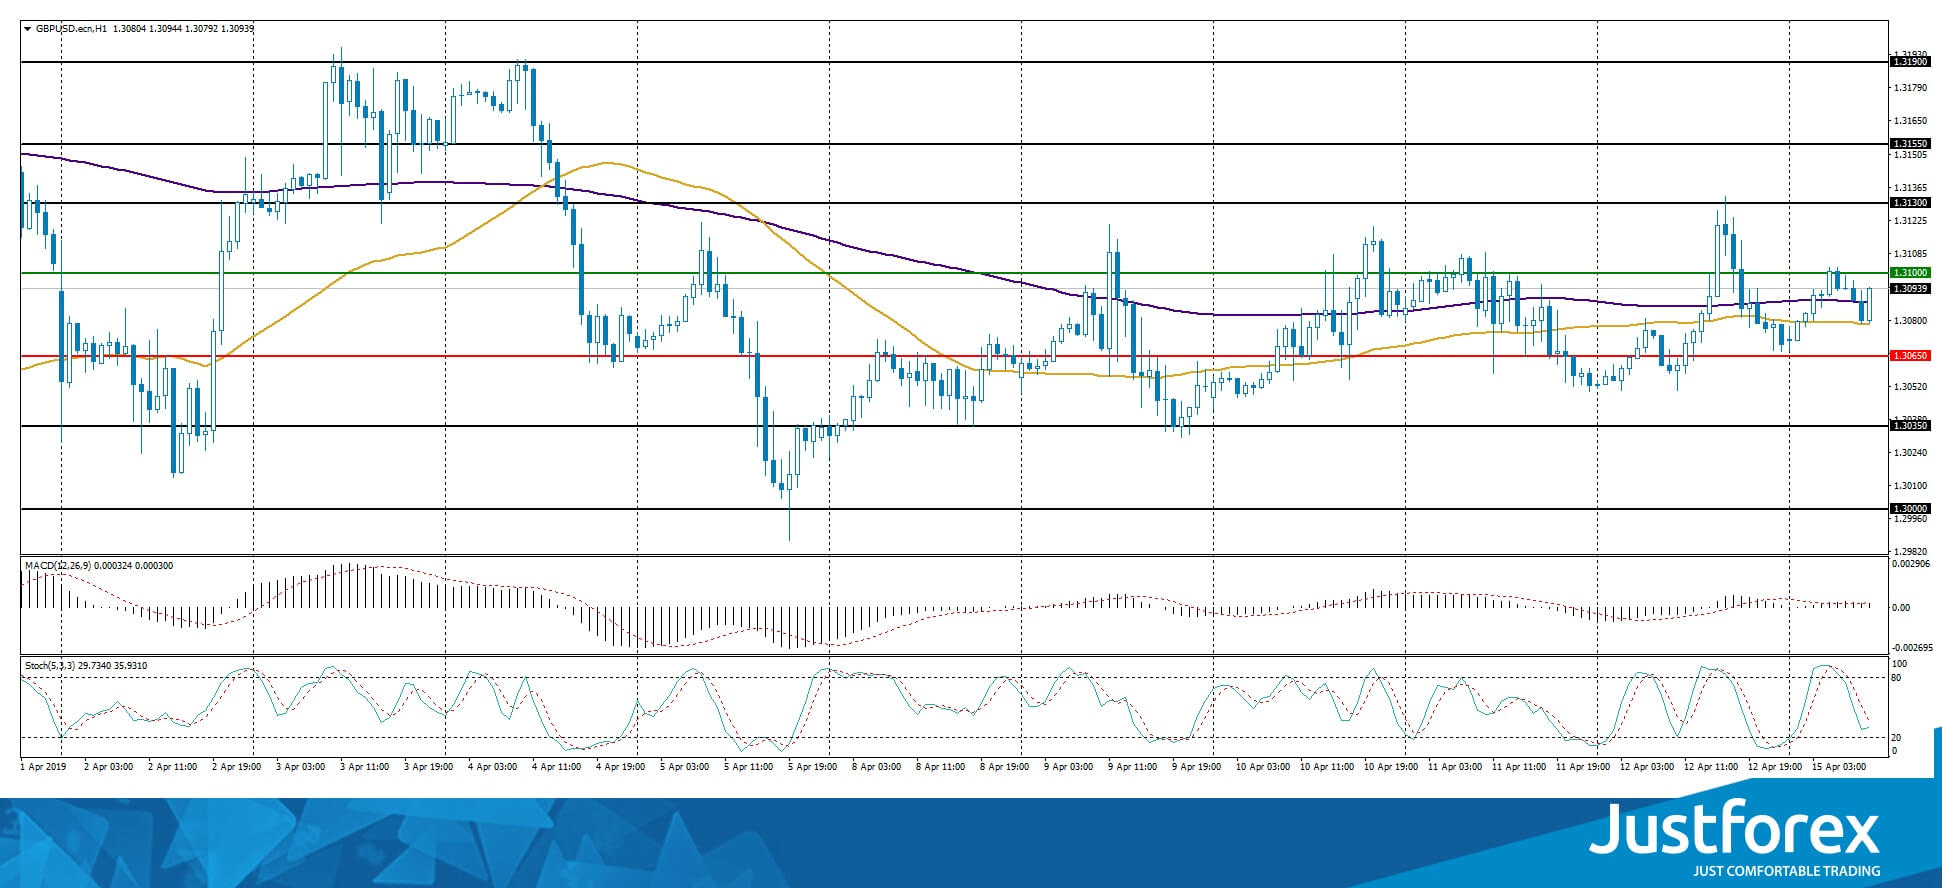
The indicators do not provide precise signals, the price has crossed 50 MA and 200 MA.
The MACD histogram is close to 0. There are no signals at the moment.
The Stochastic Oscillator is in the neutral zone, the %K line is below the %D line, which gives a signal to sell GBP/USD.
Trading recommendations
Support levels: 1.30650, 1.30350, 1.30000
Resistance levels: 1.31000, 1.31300, 1.31550
If the price fixes above 1.31000, expect the quotes to grow toward 1.31300-1.31500.
Alternatively, the quotes can fall toward 1.30400-1.30200.
The USD/CAD currency pair
Technical indicators of the currency pair:
Prev Open: 1.33845
Open: 1.33304
% chg. over the last day: -0.48
Day’s range: 1.33197 – 1.33411
52 wk range: 1.2248 – 1.3664
USD/CAD shows an ambiguous technical picture. The CAD is consolidating at 1.33200-1.33400. The USD/CAD quotes have a tendency to descend. Keep an eye on the oil quotes dynamics and open positions from the key levels.
The Economic News Feed for 15.04.2019 is calm.
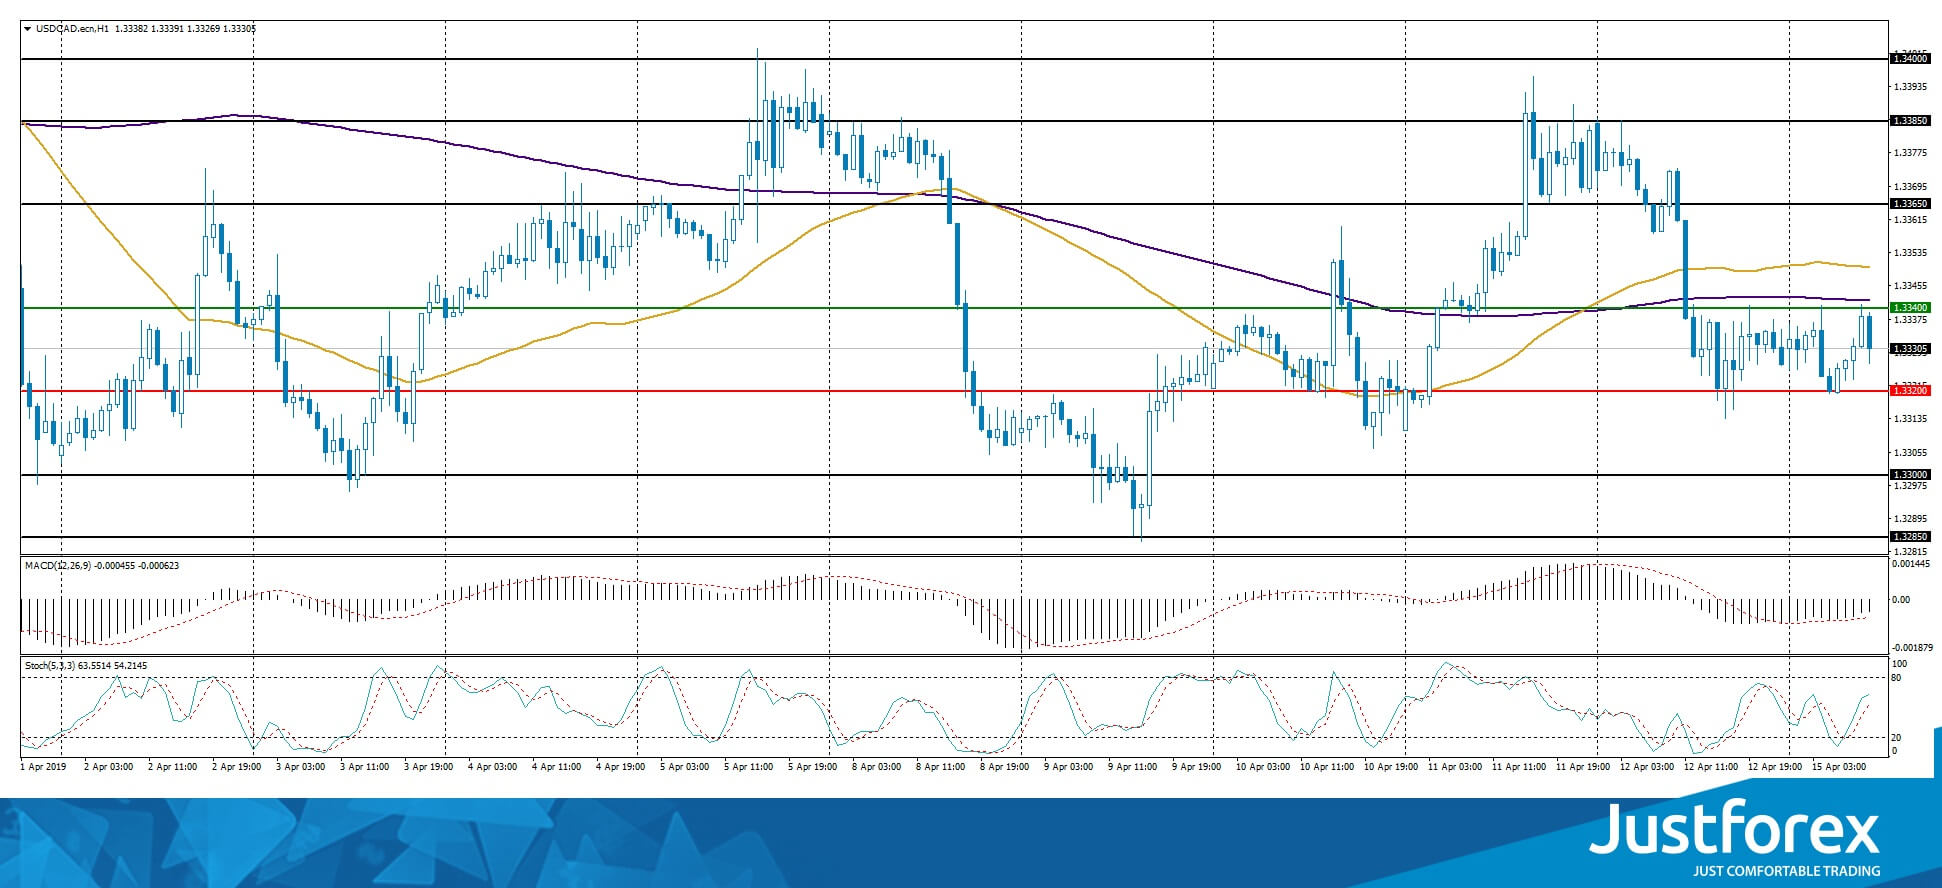
The indicators do not provide precise signals: 50 MA started to cross 200 MA.
The MACD histogram is in the negative zone but above the signal line which gives a weak signal to sell USD/CAD.
The Stochastic Oscillator is in the neutral zone, the %K line is above the %D line which points to the bullish mood.
Trading recommendations
Support levels: 1.33200, 1.33000, 1.32850
Resistance levels: 1.33400, 1.33650, 1.33850
If the price fixes below 1.33200, expect the quotes to fall toward 1.32900-1.32700.
Alternatively, the quotes can grow toward 1.33650-1.33850.
The USD/JPY currency pair
Technical indicators of the currency pair:
Prev Open: 111.640
Open: 111.961
% chg. over the last day: +0.32
Day’s range: 111.888 – 112.098
52 wk range: 104.56 – 114.56
USD/JPY stays in a bullish mood. The trading instrument reached the annual maximums. Right now the USD/JPY quotes are consolidating next to 112.000-112.100. 111.800 acts as a mirror suport. The demand for safe assets lowered, a technical correction is possible soon. Keep an eye on the US Treasury bonds’ yield and open positions from the key levels.
The Economic News Feed for 15.04.2019 is calm.
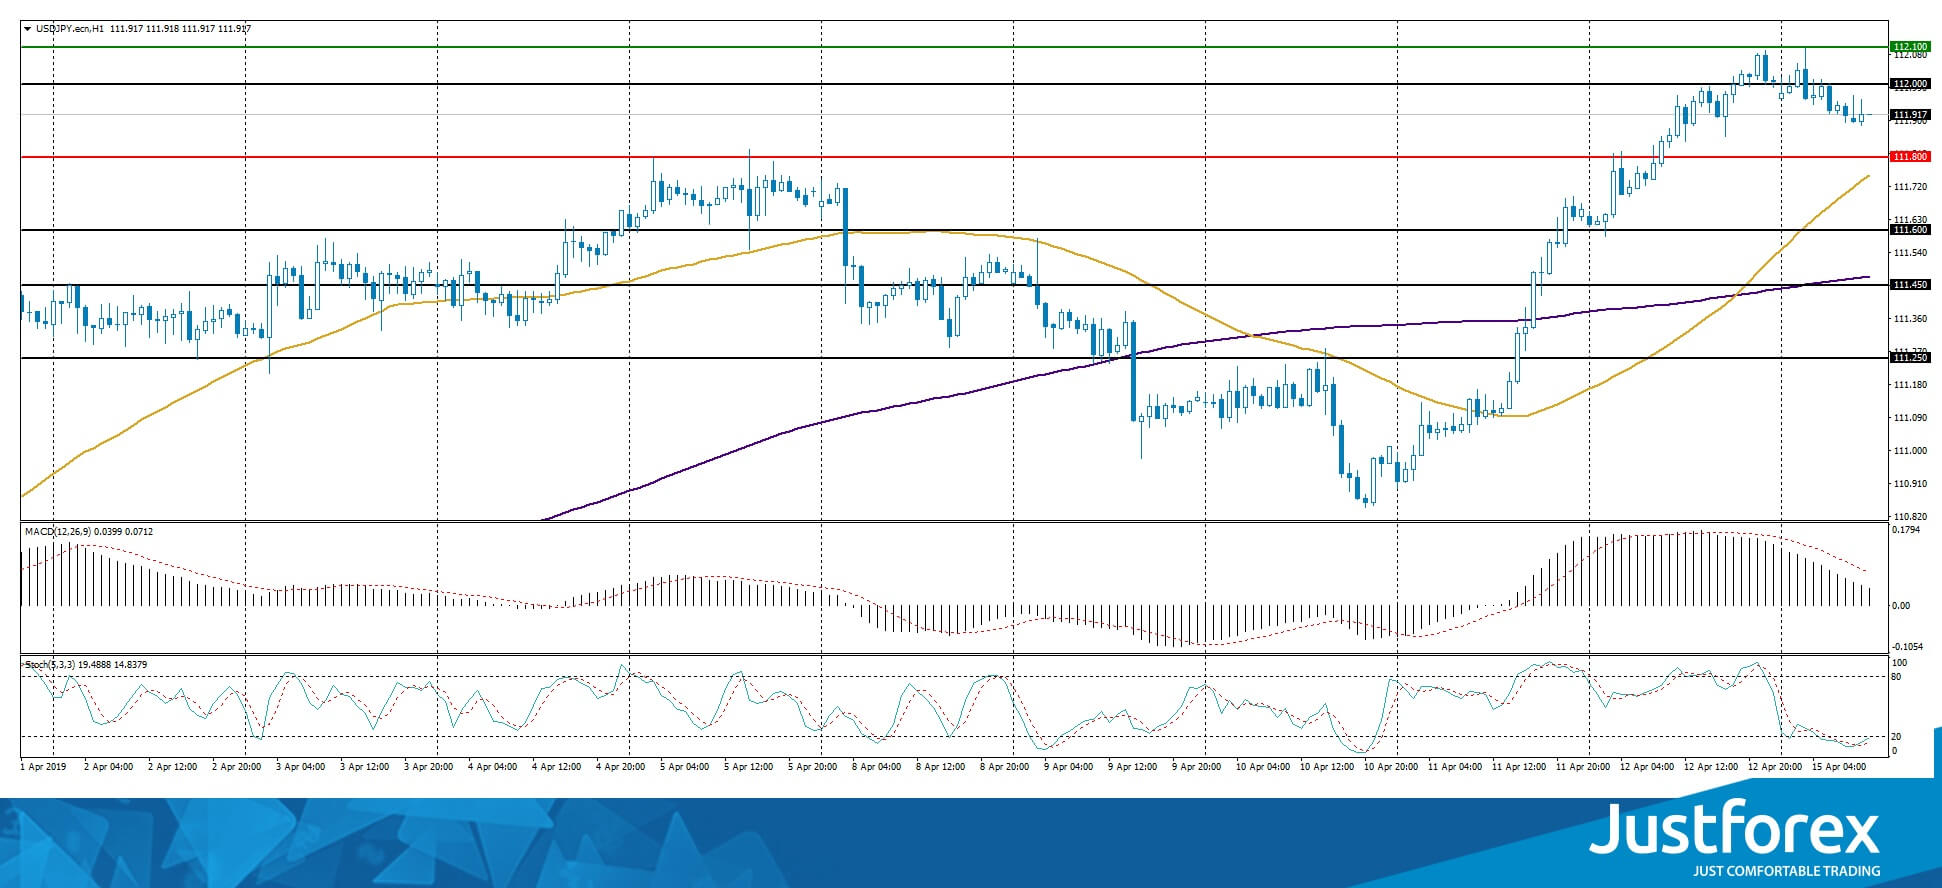
The price fixed above 50 MA and 200 MA which points to the power of the buyers.
The MACD histogram is in the positive zone but below the signal line which gives a weak signal to buy USD/JPY.
The Stochastic Oscillator is in the oversold zone, the %K line is crossing the %D line. There are no signals.
Trading recommendations
Support levels: 111.800, 111.600, 111.450
Resistance levels: 112.000, 112.400, 112.600
If the price fixes above 112.100, expect further growth toward 112.500-112.700.
Alternatively, the quotes can correct toward 111.600-111.450.


