
The EUR/USD currency pair
Technical indicators of the currency pair:
Prev Open: 1.13031
Open: 1.12812
% chg. over the last day: -0.21
Day’s range: 1.12792 – 1.13138
52 wk range: 1.1214 – 1.2557
EUR/USD keeps consolidating. Yesterday the EUR was under pressure due to the comments by the ECB representatives. Some officials think that the current economic forecasts are too positive. Right now EUR has recovered the losses and found the new key trading range at 1.12800-1.13200. The financial market participants are waiting for important releases. You should open positions from the key levels.
The Economic News Feed for 17.04.2019:
Consumer Price Index (EU) – 12:00 (GMT+3:00);
Trading Balance (US) – 15:30 (GMT+3:00);
Federal Reserve’s Beige Book (USD) – 21:00 (GMT+3:00);
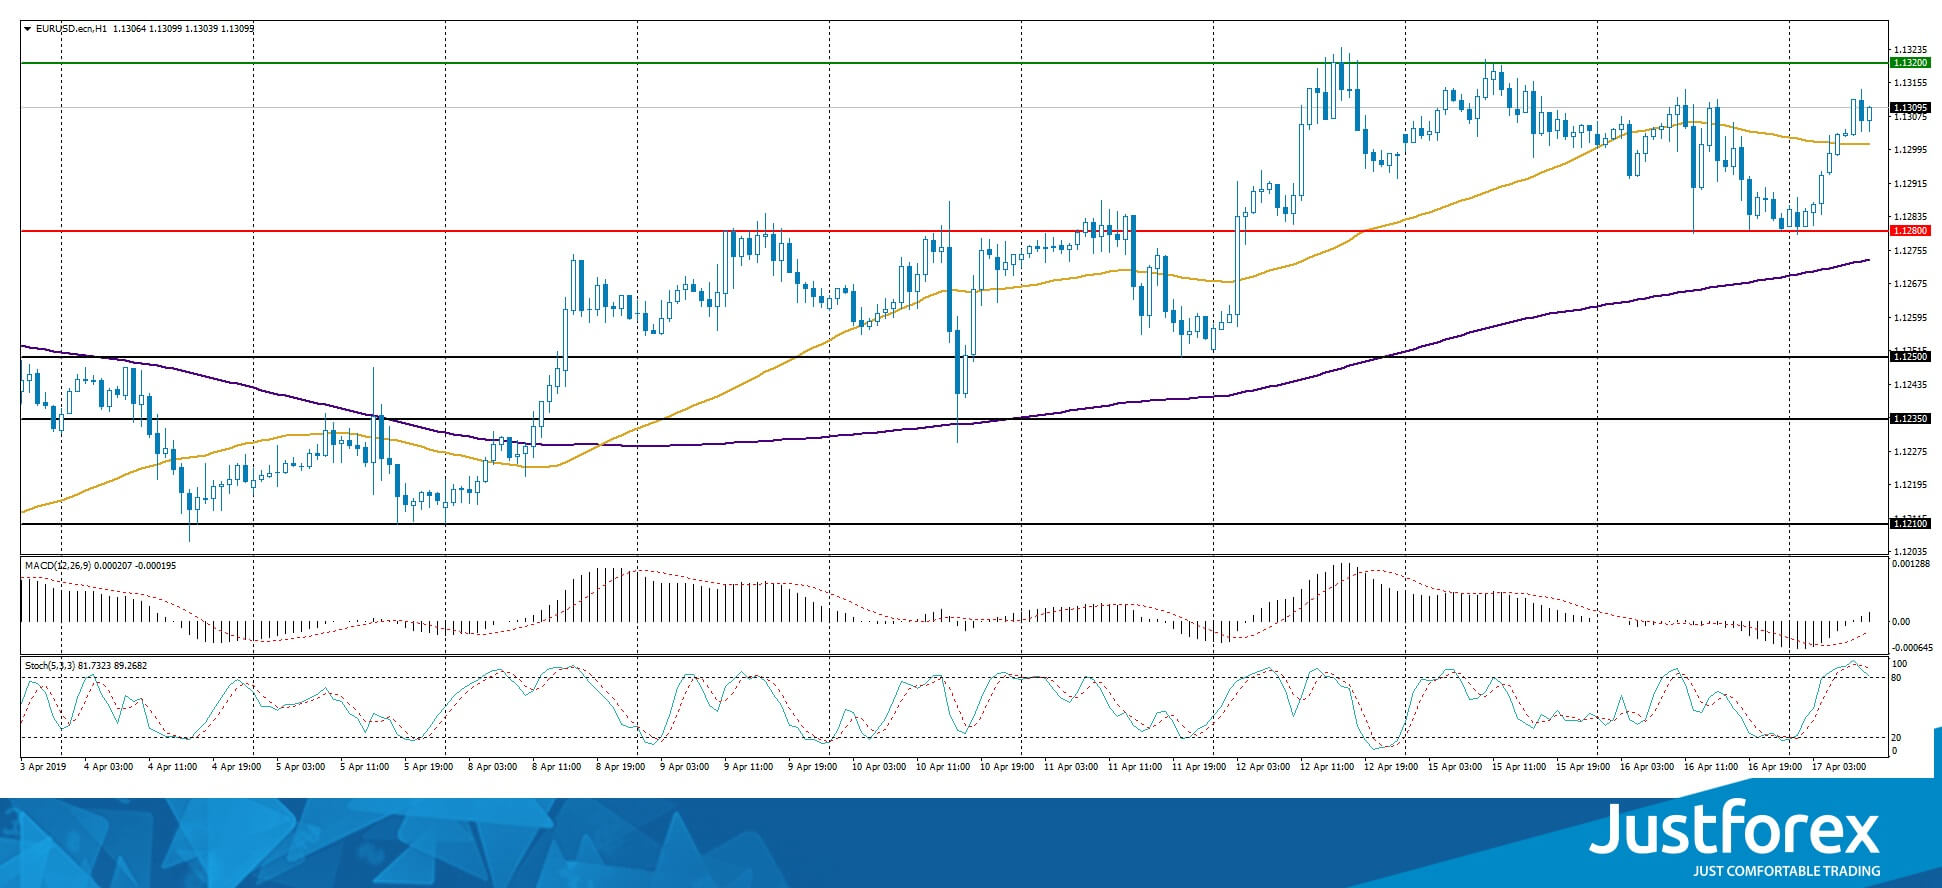
The price fixed above 50 MA and 200 MA which points to the power of the buyers.
The MACD histogram is in the positive zone, which gives a signal to buy EUR/USD.
The Stochastic Oscillator is near the overbought zone, the %K line is crossing the %D line. There are no signals at the moment.
Trading recommendations
Support levels: 1.12800, 1.12500, 1.12350
Resistance levels: 1.13200, 1.13500, 1.14000
If the price fixes above 1.13200, expect the quotes to grow toward 1.13500-1.13800.
Alternatively, the EUR/USD can fall toward 1.12600-1.12400.
The GBP/USD currency pair
Technical indicators of the currency pair:
Prev Open: 1.30883
Open: 1.30883
% chg. over the last day: -0.42
Day’s range: 1.30324 – 1.30674
52 wk range: 1.2438 – 1.4378
GBP/USD ignored an optimistic Labour Market report and closed in the red. GBP is under pressure due to The Guardian’s report on Theresa May’s and Labour Party negotiations that had supposedly hit a dead end. Right now the quotes are at 1.30350-1.30700 range. The investors are waiting for the inflation report. You should open positions from the key levels.
At 11:30 (GMT+3:00) the UK will publish a consumer price index.
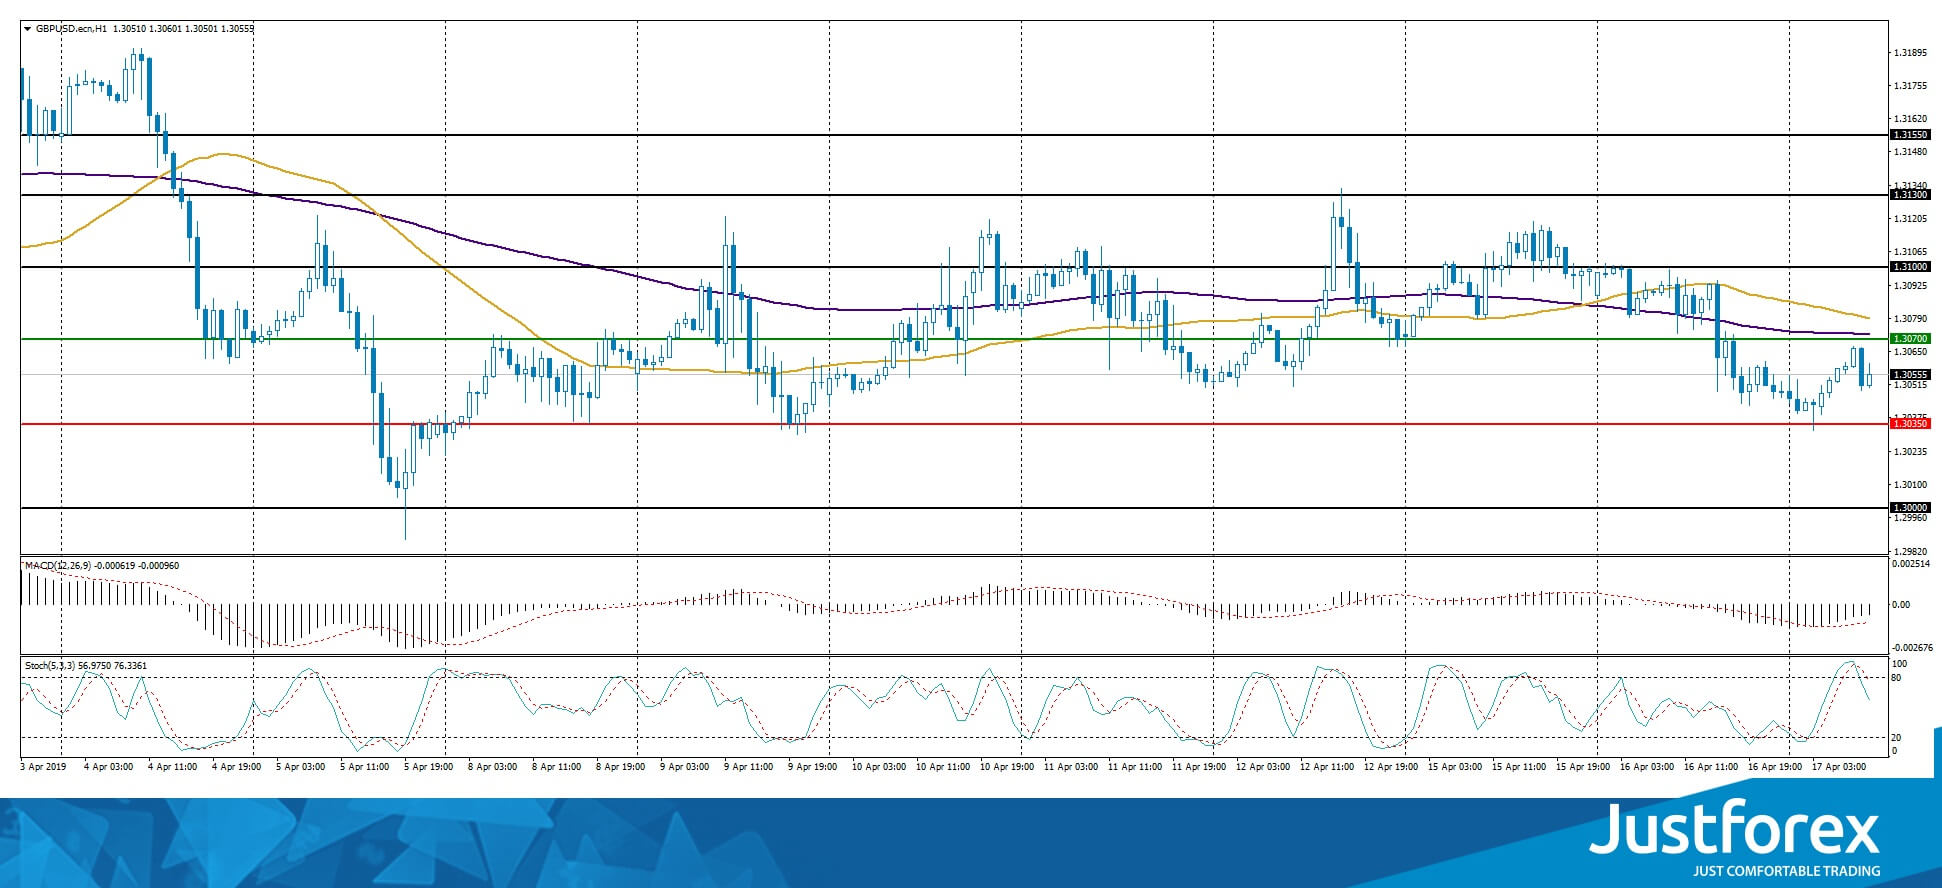
The indicators do not provide precise signals, 50 MA started to cross 200 MA.
The MACD histogram is in the negative zone but above the signal line which gives a weak signal to buy GBP/USD.
The Stochastic Oscillator started to leave the overbought zone, the %K line is below the %D line which points to the bearish mood.
Trading recommendations
Support levels: 1.30350, 1.30000
Resistance levels: 1.30700, 1.31000, 1.31300
If the price fixes below 1.30350, expect further descend towards 1.30000.
Alternatively, the quotes can recover toward 1.31000-1.31200.
The USD/CAD currency pair
Technical indicators of the currency pair:
Prev Open: 1.33662
Open: 1.33492
% chg. over the last day: -0.05
Day’s range: 1.33189 – 1.33725
52 wk range: 1.2248 – 1.3664
USD/CAD started to descend again and updated the local minimums. The prices on oil keep showing a positive trend, which supports CAD. Right now quotes are at the 1.33150 support level with 1.33500 acting as a mirror resistance. The investors expect important economic reports today. You should open positions from the key levels.
The Economic News Feed for 17.04.2019:
Basis Consumer Price Index (CAD) – 15:30 (GMT+3:00);
Trading Balance (CAD) – 15:30 (GMT+3:00);
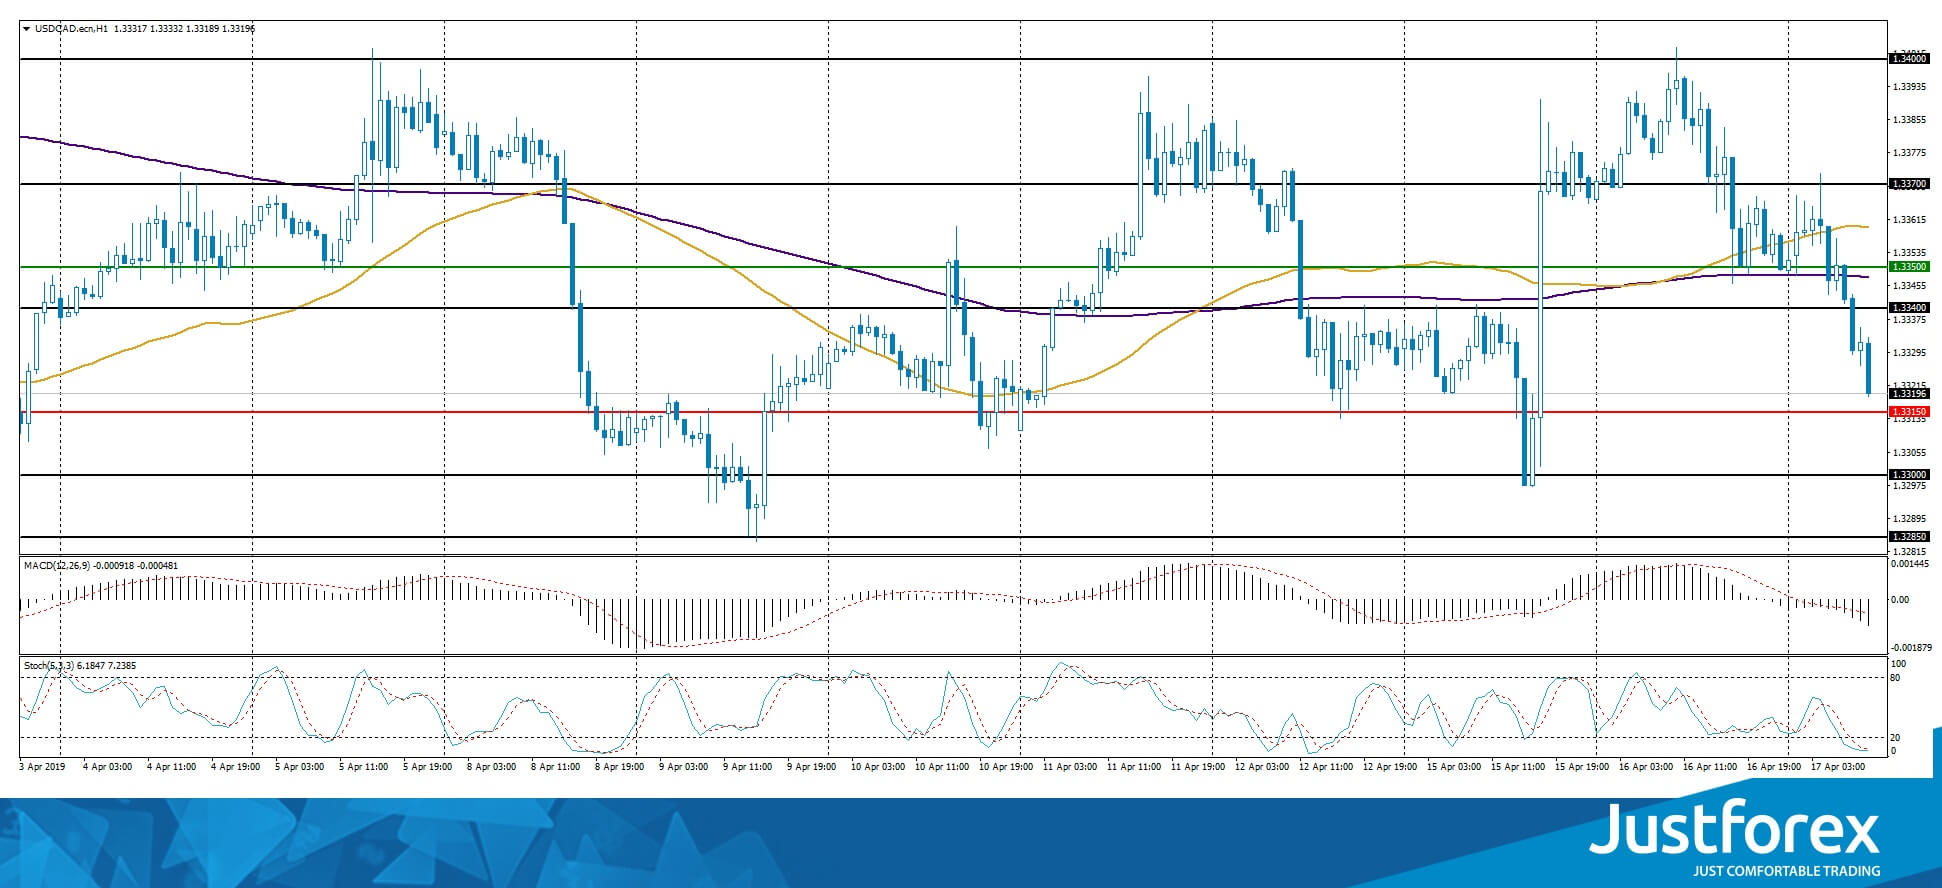
The price fixed below 50 MA and 200 MA which points to the power of the buyers.
The MACD histogram is in the negatie zone and keeps falling which points to a bearish mood.
The Stochastic Oscillator is in the oversold zone, the %K line is crossing the %D line. There are no signals at the moment.
Trading recommendations
Support levels: 1.33150, 1.33000, 1.32850
Resistance levels: 1.33500, 1.33700
If the price fixes below 1.33150, expect further descend toward 1.32850-1.32700.
Alternatively, the quotes can grow toward 1.33600-1.33800.
The USD/JPY currency pair
Technical indicators of the currency pair:
Prev Open: 112.019
Open: 111.995
% chg. over the last day: -0.03
Day’s range: 111.922 – 112.165
52 wk range: 104.56 – 114.56
USD/JPY keeps trading in a flat. There is no defined trend. The investors are waiting for important reports. Right now the key support and resistance levels are 111.800 and 112.150. You should keep an eye on the US Tresury bonds yield’s dynamic and open positions from the key levels.
During the Asian trading session, Japan published a positive trading balance report.
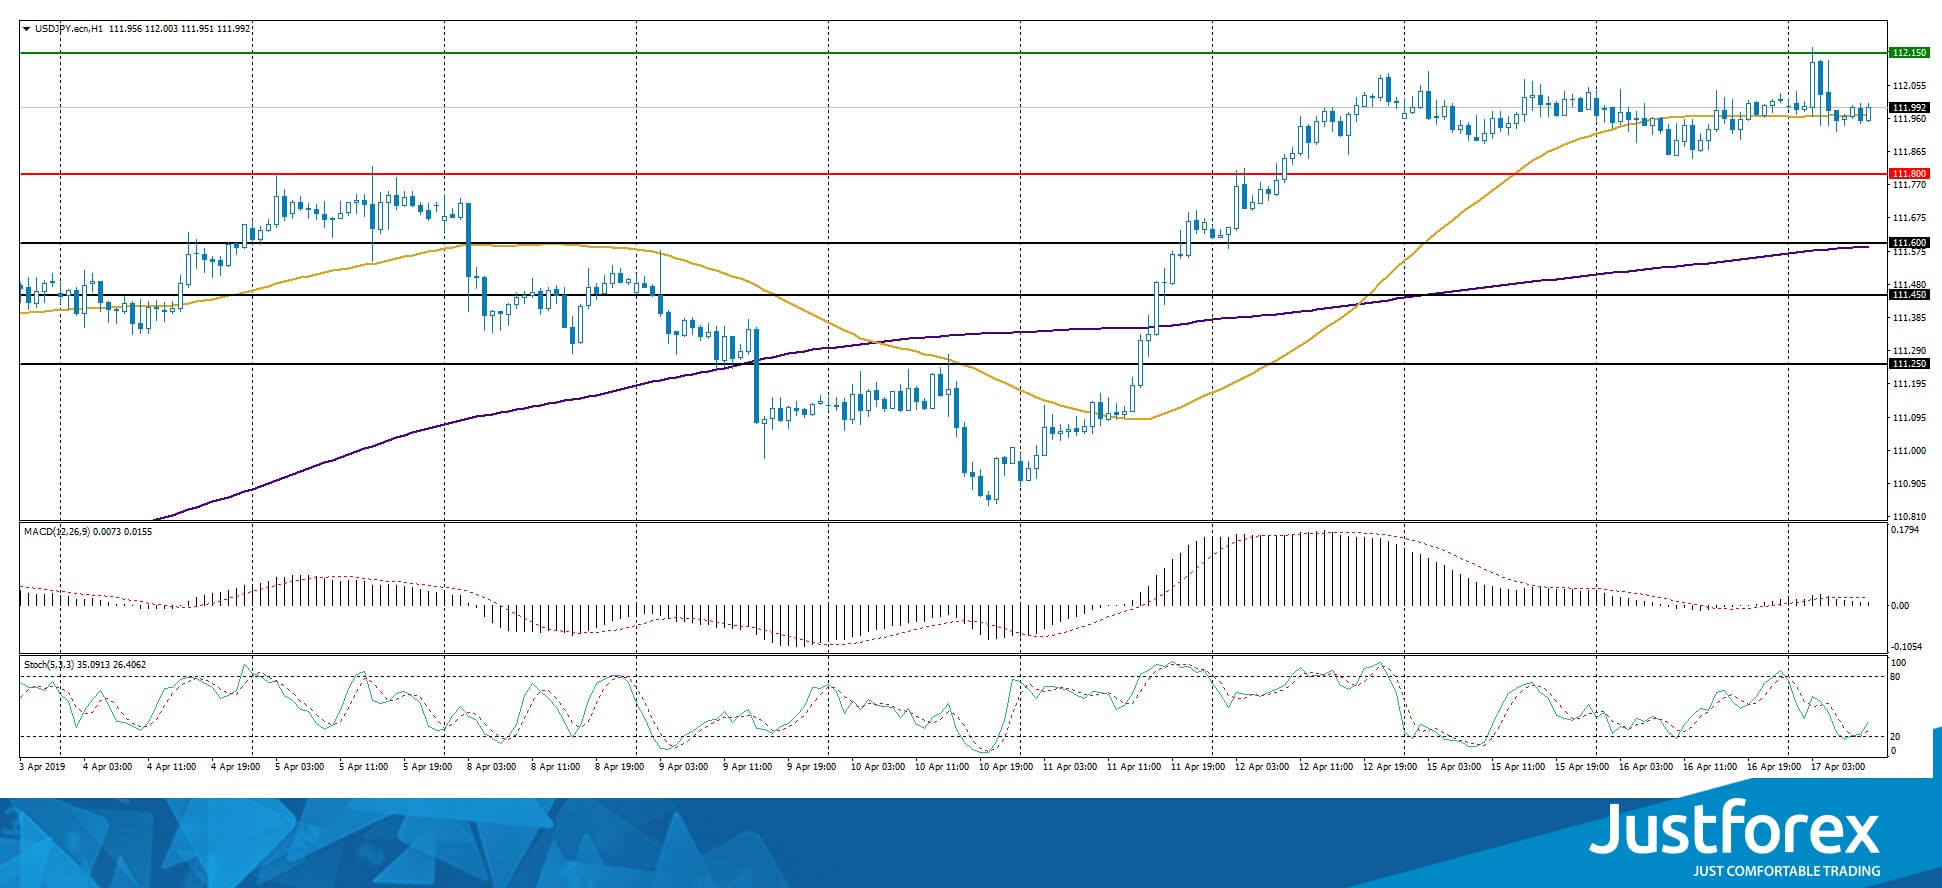
The indicators do not provide precise signals, the price has crossed 50 MA.
The MACD histogram is close to 0.
The Stochastic Oscillator is close to the oversold zone, the %K line is above the %D line which points towards buying USD/JPY.
Trading recommendations
Support levels: 111.800, 111.600, 111.450
Resistance levels: 112.150, 112.500, 112.750
If the price fixes above 112.150, expect further growth toward 112.500-112.700.
Alternatively, the quotes can correct toward 111.600-111.450.


