
A note on lower timeframe confirming price action…
Waiting for lower timeframe confirmation is our main tool to confirm strength within higher timeframe zones, and has really been the key to our trading success. It takes a little time to understand the subtle nuances, however, as each trade is never the same, but once you master the rhythm so to speak, you will be saved from countless unnecessary losing trades. The following is a list of what we look for:
- A break/retest of supply or demand dependent on which way you’re trading.
- A trendline break/retest.
- Buying/selling tails … essentially we look for a cluster of very obvious spikes off of lower timeframe support and resistance levels within the higher timeframe zone.
- Candlestick patterns. We tend to only stick with pin bars and engulfing bars as these have proven to be the most effective.
We typically search for lower-timeframe confirmation between the M15 and H1 timeframes, since most of our higher-timeframe areas begin with the H4. Stops are usually placed 1-3 pips beyond confirming structures.
EUR/USD
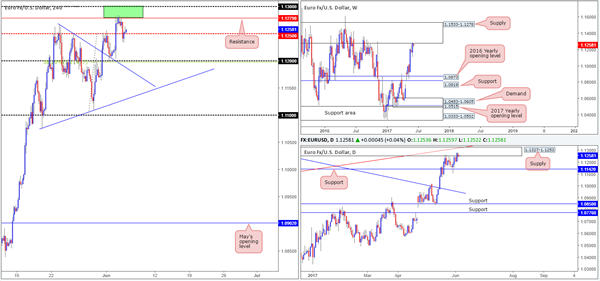
For those who read Monday’s report you may recall our team highlighting the 1.13/1.1279 H4 area as a potential sell zone (round number/H4 resistance). Additionally, we also liked the fact that the H4 zone formed within both weekly and daily supplies (1.1533-1.1278/1.1327-1.1253). As anticipated, H4 price sold off from the above said zone and briefly slipped below the mid-level support at 1.1250. Well done to any of our readers who took this trade as the first take-profit zone, also highlighted on Monday, was set at 1.1250.
Although H4 price is trading back above 1.1250, pressure from the higher-timeframe supplies will likely be too great for the bulls here. We’re expecting at least the 1.12 handle to be achieved.
Our suggestions: Unfortunately our team missed the sell from 1.13/1.1279. All may not be lost though. Should the unit retest this zone today and print a reasonably sized H4 bearish candle from here, preferably a full-bodied candle, we would again look to short, targeting 1.1250 as an initial zone. The reason for needing this additional confluence is, apart from this being a second retest, mainly because we feel price may look to challenge 1.30 and possibly whipsaw above it before serious sellers step in.
Data points to consider: No high-impacting news on the docket today.
Levels to watch/live orders:
- Buys: Flat (stop loss: N/A).
- Sells: 1.13/1.1279 ([waiting for a reasonably sized H4 bear candle – preferably a full-bodied candle – to form before pulling the trigger is advised] stop loss: ideally beyond the candle’s wick).
GBP/USD
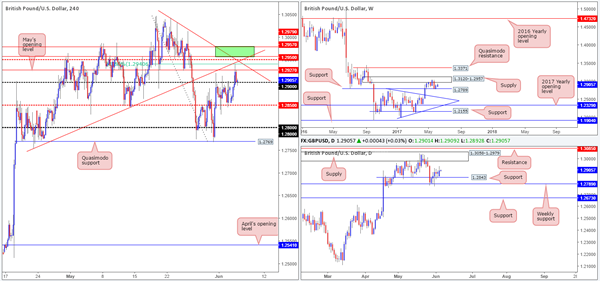
Despite the somewhat bearish start to the week, the bulls were in relatively fine form during yesterday’s sessions. The pair ran through offers at 1.29, whipsawed above May’s opening level at 1.2927 and challenged the H4 61.8% Fib resistance at 1.2941 (converged with a H4 trendline resistance taken from the low 1.2754), before showing any signs of weakness. The pullback from this Fib level has brought price back down to 1.29, which, as you can see, is holding firm as support for the time being.
Based on recent movement, the area we actually have our eye on at the moment, assuming 1.29 continues to hold steady, is 1.2957/1.2979. This green area seen on the H4 chart represents the underside of weekly and daily supplies, and also sits just above the H4 mid-level resistance at 1.2950.
Our suggestions: Although our team has expressed interest at 1.2957/1.2979, they’ve noted that to trade this zone, a reasonably sized H4 bearish candle would also need to form from here, preferably a full-bodied candle. This is simply because there’s a large psychological number 1.30 lurking just above, which has ‘trade me’ written all over it.
Data points to consider: No high-impacting news on the docket today.
Levels to watch/live orders:
- Buys: Flat (stop loss: N/A).
- Sells: 1.2957/1.2979 ([waiting for a reasonably sized H4 bear candle – preferably a full-bodied candle – to form before pulling the trigger is advised] stop loss: ideally beyond the candle’s wick).
AUD/USD
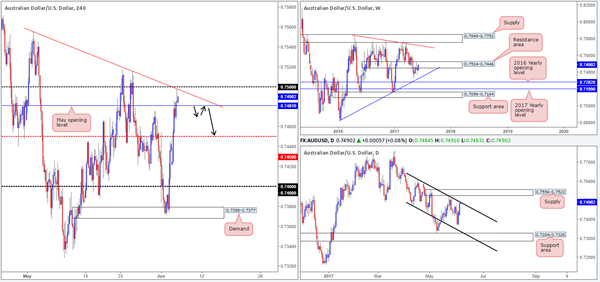
On Monday we saw the Aussie bulls go on the offensive for a second consecutive day, despite weekly price being housed within the walls of a resistance area logged at 0.7524-0.7446. What’s also notable from a technical perspective is that daily price is now seen shaking hands with a channel resistance taken from the high 0.7610.
Given the higher-timeframe resistances in play right now and the fact that 0.75 is lurking just ahead on the H4 chart, it would, in our humble opinion, be chancy to initiate any long positions at the moment. In regards to selling, however, we’d need to see the bears prove themselves as worthy contenders before we show interest.
Our suggestions: To confirm bearish strength, a H4 close back below May’s opening level at 0.7481 would be ideal. This would also clear the runway south down to at least the H4 mid-level support at 0.7450, and quite possibly beyond. Therefore, taking a short on the break/retest of 0.7481 would (as per the black arrows) be something we’d be interested in.
Data points to consider: RBA rate statement at 5.30am GMT+1.
Levels to watch/live orders:
- Buys: Flat (stop loss: N/A).
- Sells: Watch for H4 price to engulf 0.7481 and then look to trade any retest seen thereafter ([waiting for a lower-timeframe confirming sell signal following the retest is advised – see the top of this report] stop loss: dependent on where one confirms this level.
USD/JPY
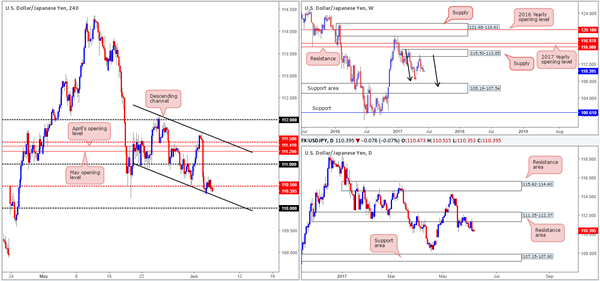
H4 bulls were seen struggling to register any noteworthy movement from the channel support taken from the low 110.92 during yesterday’s trading. The reason we believe this be the case is simply due to the higher-timeframe structures. Weekly bears remain in a relatively strong position after pushing aggressively lower from supply registered at 115.50-113.85. We know there’s a lot of ground to cover here, but this move could possibly result in further downside taking shape in the form of a weekly AB=CD correction (see black arrows) that terminates within a weekly support area marked at 105.19-107.54 (stretches all the way back to early 2014). In conjunction with weekly flow, daily price continues to defend the resistance area penciled in at 111.35-112.37, which could see price drive lower in the coming week to 107.15-107.90: a support zone that’s glued to the top edge of the said weekly support area.
Our suggestions: With the above notes in mind, our desk will be looking for shorts in this market. Should the current H4 candle close as is, we would be very tempted to short. In the event that this comes to fruition, stops would be tucked above 110.50, and we’d initially be targeting the 110 handle as a first take-profit zone.
Data points to consider: No high-impacting news on the docket today.
Levels to watch/live orders:
- Buys: Flat (stop loss: N/A).
- Sells: 110.50 region ([waiting for the current H4 candle to close before making a decision as to where a short is viable or not] stop loss: 110.55).
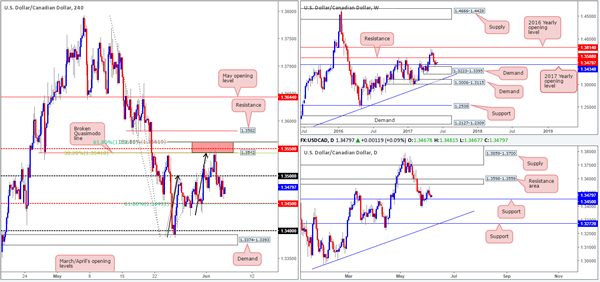
USD/CAD
The 1.35 handle, as you can see, managed to hold firm as resistance yesterday. The next downside target from this angle sits at the H4 mid-level support drawn from 1.3450, which also represents a daily support and unites with a 61.8% H4 Fib support line taken from the low 1.3387. Given that this level is also positioned nearby the 2017 yearly opening level at 1.3434 seen on the weekly chart, we will be looking for price to bounce higher from this region today.
Our suggestions: While a bounce from 1.3434/1.3450 is high probability, we’d still recommend waiting for the lower timeframes to prove buyer interest exists here (see the top of this report). This will help avoid an unnecessary loss on a potential fake down to the 1.34 hurdle.
Data points to consider: No high-impacting news on the docket today.
Levels to watch/live orders:
- Buys: 1.3450 region ([waiting for a lower-timeframe buy signal to print is advisable] stop loss: dependent on where one confirms this line).
- Sells: Flat (Stop loss: N/A).
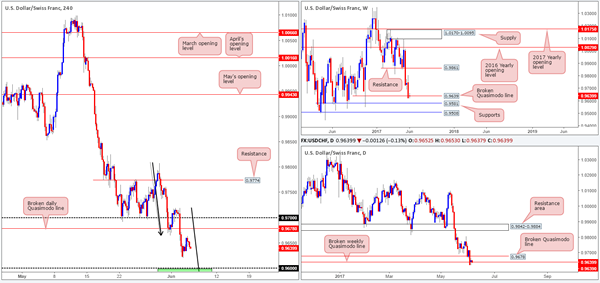
USD/CHF
Kicking this morning’s report off with a look at the weekly timeframe, we can see price trading around 0.9639: a recently broken Quasimodo line. The next downside target beyond this line is seen around a support level drawn from 0.9581. Down on the daily chart, however, the unit shows the break below the above said weekly Quasimodo line could have potentially cleared the path south all the way down to 0.9546: a daily triple-bottom formation. Should price reach this line, nevertheless, we’d be wary of taking a long from here since a daily Quasimodo support level is seen lurking just below at 0.9488.
On the H4 chart, the candles are seen lurking 40 pips ahead of the 0.96 handle. 0.96, in our opinion, still deserves attention! Not only is it positioned nearby the weekly support mentioned above at 0.9581, it also sits close to a H4 AB=CD (see black arrows) 161.8% bullish completion point at 0.9572.
Our suggestions: Wait for H4 price to attack 0.9572/0.96 and watch to see if the H4 candles can print a reasonably sized H4 bull candle, preferably a full-bodied candle, before pushing the buy button. This, of course, will by no means guarantee a winning trade, but it will help determine buyer interest and help avoid an unnecessary loss! The first take-profit target from this base will be set around the broken daily Quasimodo line at 0.9678.
Data points to consider: No high-impacting news on the docket today.
Levels to watch/live orders:
- Buys: 0.9572/0.96 ([waiting for a reasonably sized H4 bull candle – preferably a full-bodied candle – to form before pulling the trigger is advised] stop loss: ideally beyond the candle’s tail).
- Sells: Flat (stop loss: N/A).
DOW 30
US equity prices are unchanged this morning, despite the index ranging 54 points. With this, much of the following report will echo thoughts put forward from yesterday’s analysis…
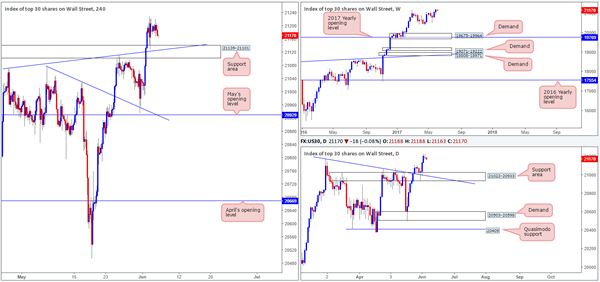
Over the course of last week’s trading, US equities punched to fresh record highs at 21229. The move came after a three-month consolidation, which achieved an ultimate low of 20371 back in mid-April. The story on the daily chart shows that the unit extended Wednesday’s bounce further on Friday from the support area pegged at 21022-20933, which, as we already know, achieved fresh all-time highs.
For those who read Friday’s report you may remember we mentioned to keep an eye on the H4 support area at 21139-21101 (intersects with a H4 trendline support etched from the high 21072) for a potential bounce north. As you can see, this played out perfectly! Well done to any of our readers who managed to jump in long on this one! With the market showing little resistance up ahead, we believe the DOW will likely continue to push higher in the coming week.
Our suggestions: Based on recent trading, we’re still interested in trading long from the said H4 support area. However, for this happen, we’d need to see price retest the support area for a second time and hold firm. It would be absolutely fantastic to see a bullish H4 candle present itself from here in the shape of a full-bodied candle, as we’d have little hesitation in jumping in long from this base!
Data points to consider: No high-impacting news on the docket today.
Levels to watch/live orders:
- Buys: 21139-21101 ([waiting for a reasonably sized H4 bull candle to form – preferably a full-bodied candle – is advised] stop loss: ideally beyond the candle’s tail).
- Sells: Flat (stop loss: N/A).
GOLD
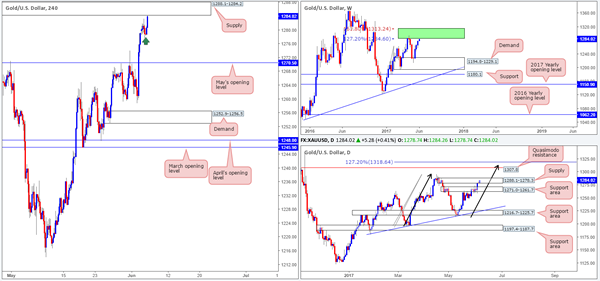
Despite daily price printing a bearish pin bar around the underside of a daily supply zone pegged at 1288.1-1278.3 during yesterday’s segment, the bulls have continued to press higher in recent hours. What’s interesting about this daily zone is that it’s glued to the underside of an area comprised of two weekly Fibonacci extensions 161.8/127.2% at 1313.7/1285.2 taken from the low 1188.1 (green zone).
The recent advance has, as you can see on the H4 chart, led to price challenging the H4 supply zone seen at 1288.1-1284.2. As mentioned in Monday’s report, this H4 supply area is attractive since it is located within the upper limits of the daily supply and also positioned within the lower limits of the green weekly zone. Therefore, we believe it will, at the very least, bounce price lower.
Our suggestions: Our team is now short from 1284.0 with a stop planted at 1288.9. Ultimately, we’re going to be looking to reduce risk to breakeven around the nearby H4 demand marked with a green arrow at 1278ish. From thereon, we’d have our eye on May’s opening level at 1270.5, which happens to be positioned within a daily support area at 1271.0-1261.7 (the next downside target on the daily timeframe).
Levels to watch/live orders:
- Buys: Flat (stop loss: N/A).
- Sells: 1284.0 ([live] stop loss: 1288.9).


