
The EUR/USD currency pair
Technical indicators of the currency pair:
Prev Open: 1.11501
Open: 1.11812
% chg. over the last day: -0.28
Day’s range: 1.11726 – 1.12056
52 wk range: 1.1111 – 1.2009
EUR/USD started to recover and updated the local maximums. The investors began to fix positions after a long rally. The escalation of the trade war between Washington and Beijing increased the expectation for the FRS to lower the interest rates this year. An additional pressure is cause by the negative trends in the US Treasury bonds’ yield. The market participants are watching the EU Parliament elections. The quotes are consolidating around 1.11800-1.12000. You should open positions from these levels. EUR has prospects for further recovery.
The Economic News Feed for 24.05.2019:
Report on the Orders of Durable Goods (US) – 15:30 (GMT+3:00);
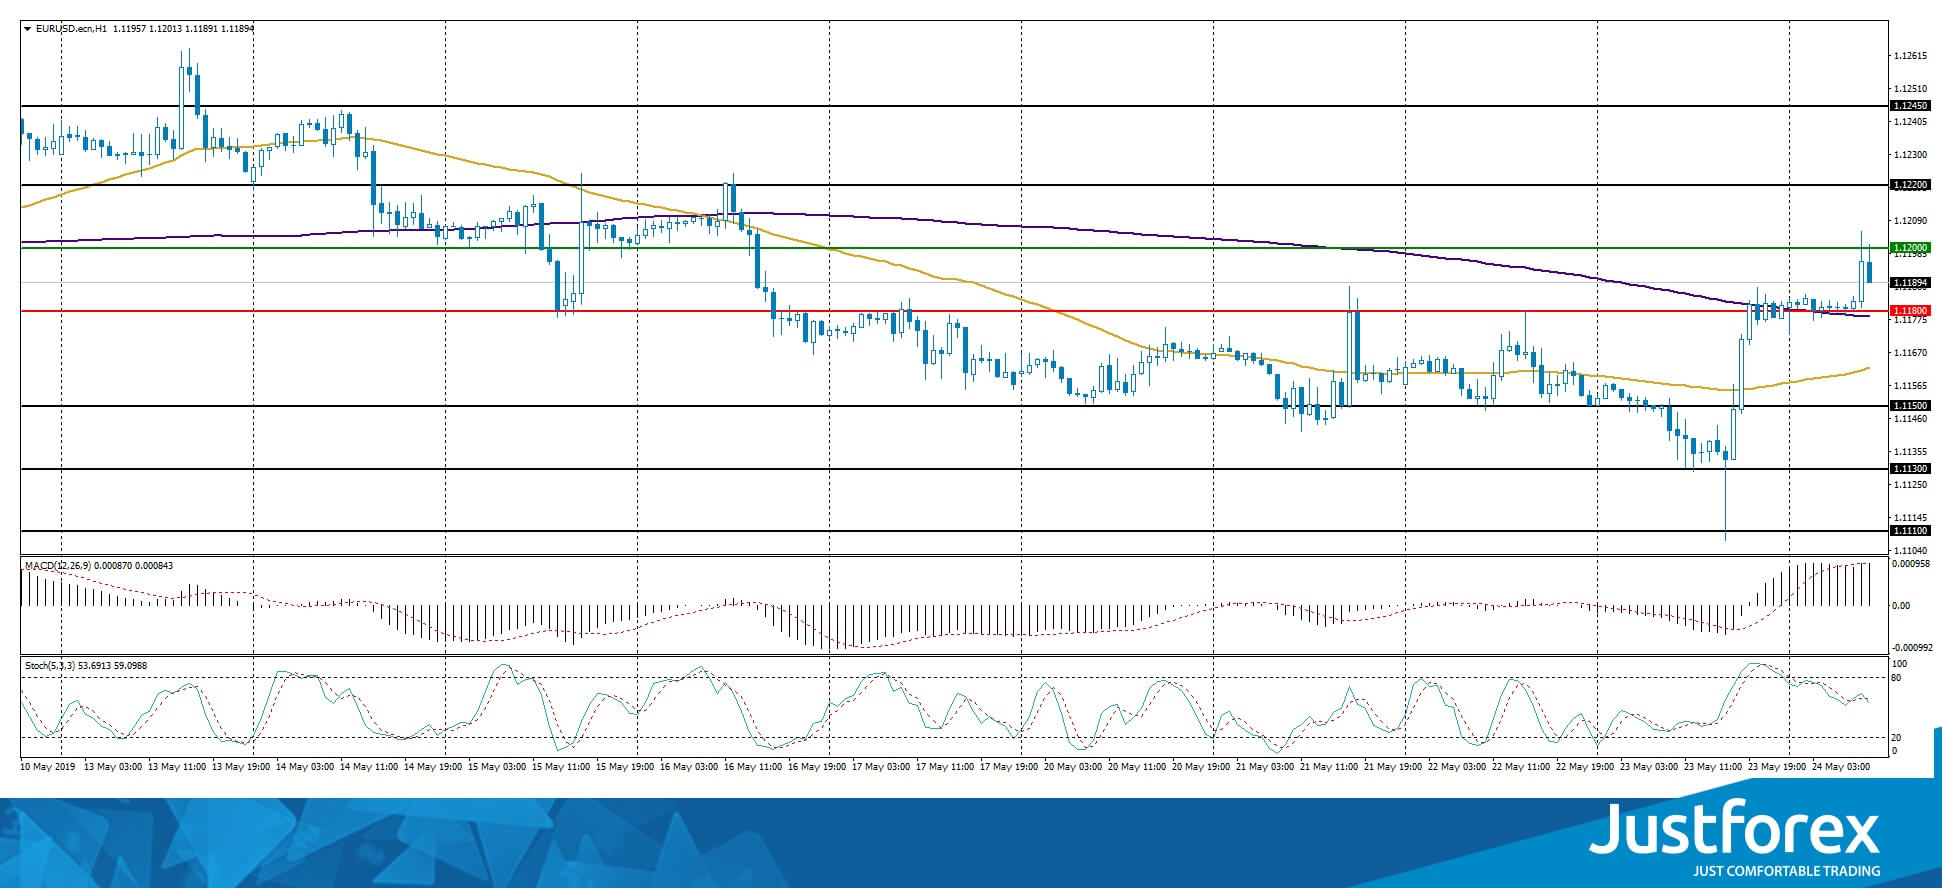
The price fixed above 200 MA which points towards the power of the buyers.
The MACD histogram is in the positive zone and keeps rising which points towards a further correction of the EUR/USD quotes.
The Stochastic Oscillator is in the neutral zone, the %K line is crossing the %D line. There are no signals at the moment.
Trading recommendations
Support levels: 1.11800, 1.11500, 1.11300
Resistance levels: 1.12000, 1.12200, 1.12450
If the price fixes above 1.12000, expect further descend towards 1.12300-1.12500.
Alternatively, the quotes can descend towards 1.11500-1.11300.
The GBP/USD currency pair
Technical indicators of the currency pair:
Prev Open: 1.26516
Open: 1.26525
% chg. over the last day: +0.01
Day’s range: 1.26477 – 1.26879
52 wk range: 1.2438 – 1.3631
GBP/USD stabilized after a long descend. The GBP is consolidating. The local support and resistance levels are 1.26500 and 1.27000. The market participants are waiting for the relevant info regarding Brexit. A technical correction remains possible. You should open positions from the key levels.
At 11:30 (GMT+3:00) the UK will publish a retail sales report.
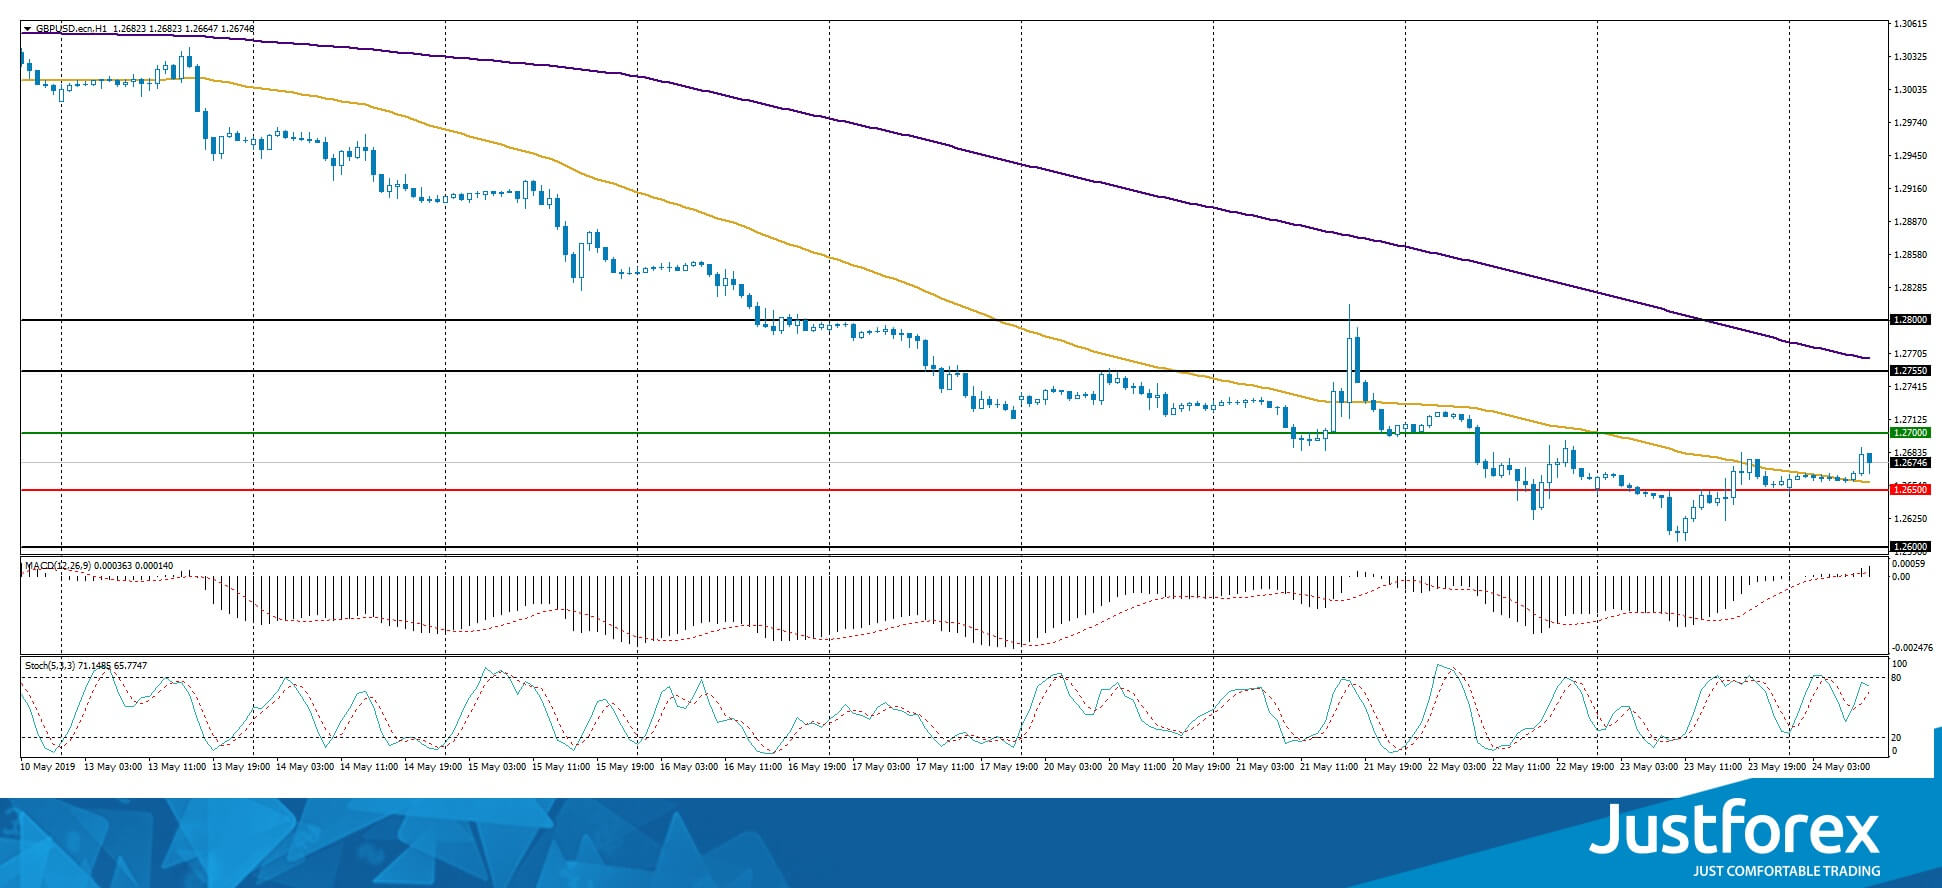
The indicators do not provide precise signals, the price has crossed 50 MA.
The MACD histogram has moved into a positive zone which points towards a correction of GBP/USD.
The Stochastic Oscillator is in the neutral zone, the %K line started to cross the %D line. There are no signals at the moment.
Trading recommendations
Support levels: 1.26500, 1.26000
Resistance levels: 1.27000, 1.27550, 1.28000
If the price fixes above 1.27000, expect further correction towards 1.27500-1.27800.
Alternatively, the quotes can fall towards 1.26200-1.26000.
The USD/CAD currency pair
Technical indicators of the currency pair:
Prev Open: 1.34356
Open: 1.34721
% chg. over the last day: +0.33
Day’s range: 1.34459 – 1.34824
52 wk range: 1.2727 – 1.3664
USD/CAD started to descend after a sharp growth. The trading instrument updated the local minimums. The key support and resistance levels are 1.34450 and 1.34700. The demand for USD weakens. Keep an eye on the oil quotes dynamics and open positions from the key levels.
The Economic News Feed for 24.05.2019 is calm.
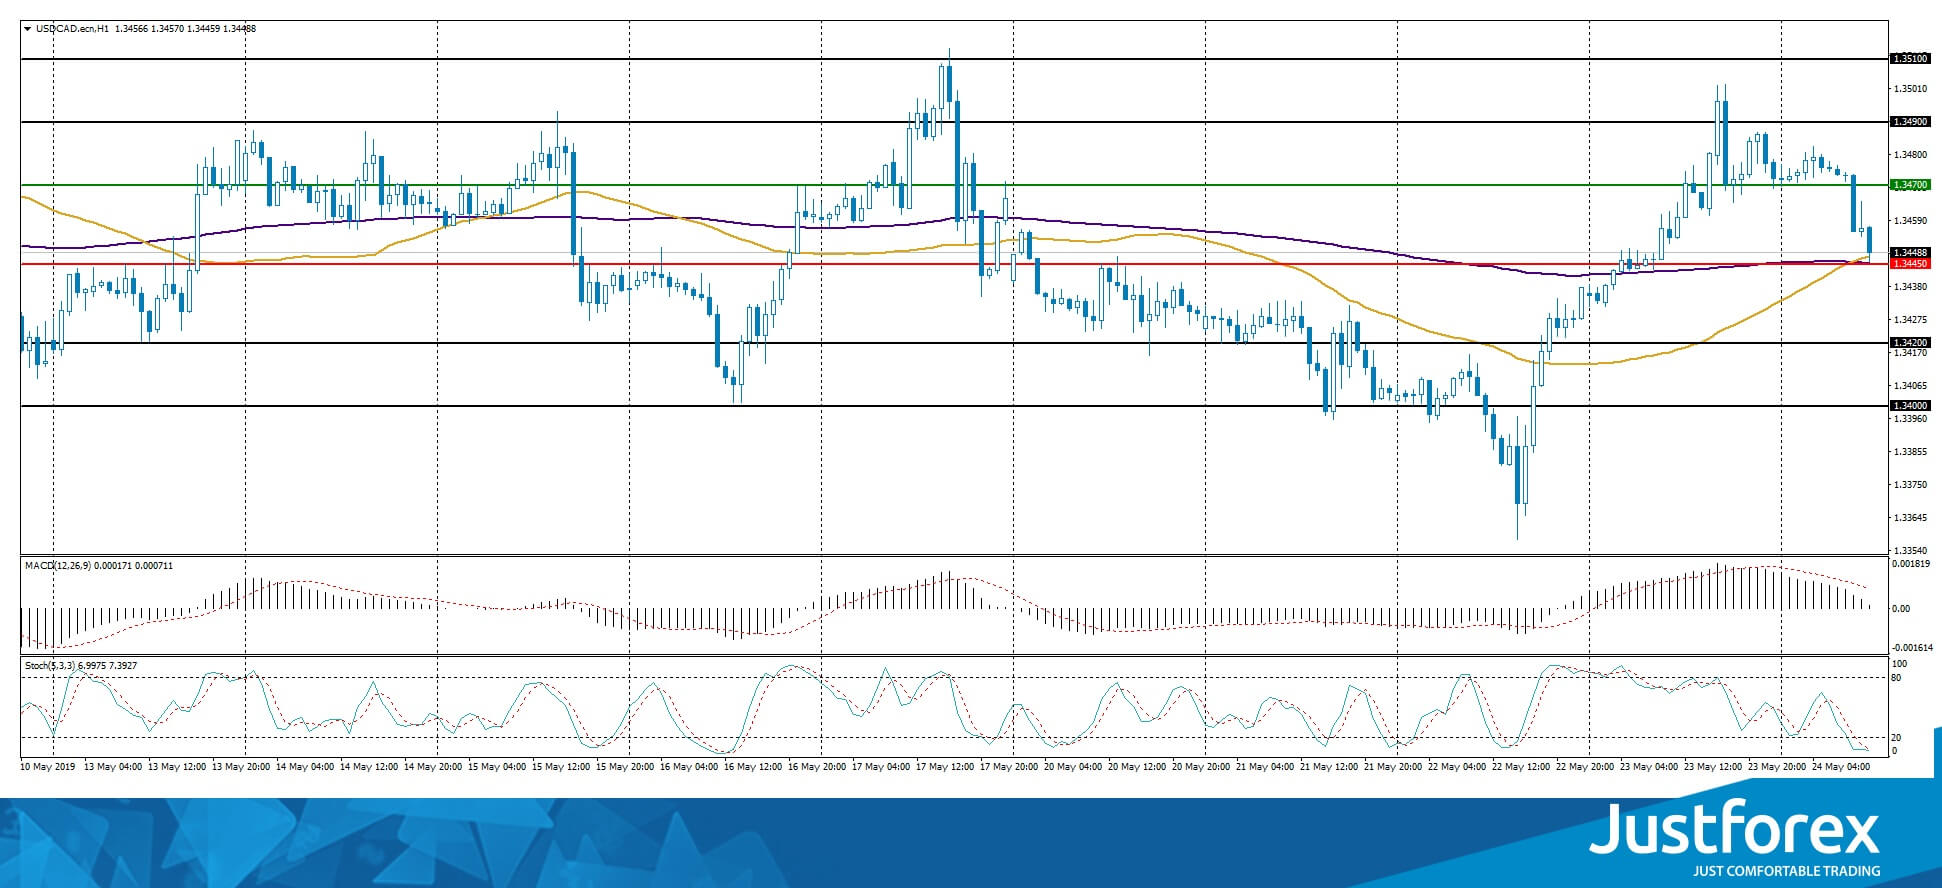
The indicators do not provide precise signals: 50 MA has crossed 200 MA.
The MACD histogram is close to 0.
The Stochastic Oscillator is in the oversold zone, the %K line started to cross the %D line. There are no signals at the moment.
Trading recommendations
Support levels: 1.34450, 1.34200, 1.34000
Resistance levels: 1.34700, 1.34900, 1.35100
If the price fixes below 1.34450, epxect a correction towards 1.34000.
Alternatively, the quotes can grow towards 1.34800-1.35000.
The USD/JPY currency pair
Technical indicators of the currency pair:
Prev Open: 110.333
Open: 109.594
% chg. over the last day: -0.73
Day’s range: 109.456 – 109.745
52 wk range: 104.97 – 114.56
USD/JPY is showing an agressive bearish trend. The quotes have descended by 70 points. The demand for the safe assets has grown since the trade negotiations between the US and China seem to have reached a dead end. Right now the quotes are consolidating around 109.500-109.750. Keep an eye on the US economic reports. The currency pair has a tendency to descend.
The national basis consumer price index in Japan for April confirmed the market expectations and reached 0.9%.
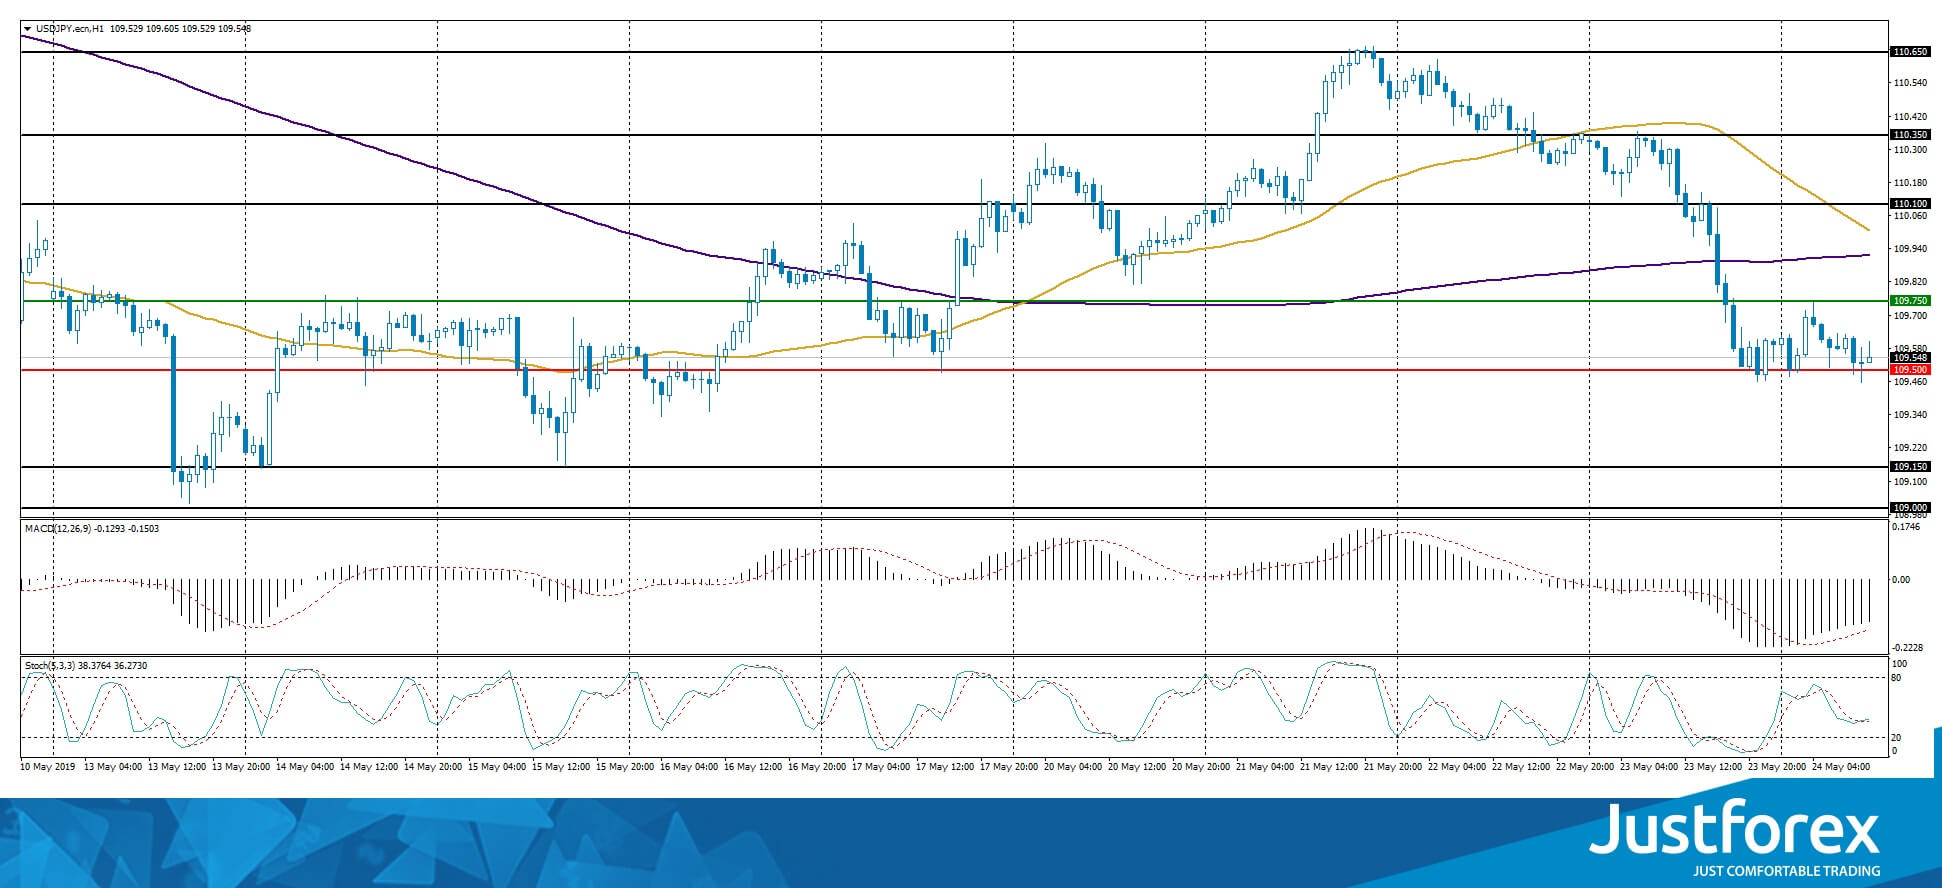
The price fixed below 200 MA which points towards the power of the sellers.
The MACD histogram is in the negative zone but above the signal line which gives a weak signal to sell USD/JPY.
The Stochastic Oscillator is in the neutral zone, the %K line is crossing the %D line. There are no signals at the moment.
Trading recommendations
Support levels: 109.500, 109.150, 109.000
Resistance levels: 109.750, 110.100, 110.350
If the price fixes below 109.500, expect further descend towards 109.150-109.000.
Alternatively, the quotes can grow towards 110.000-110.200.


