
The EUR/USD currency pair
Technical indicators of the currency pair:
Prev Open: 1.11310
Open: 1.11288
% chg. over the last day: -0.02
Day’s range: 1.11252 – 1.11403
52 wk range: 1.1111 – 1.2009
EUR stabilized after a long fall since the beginning of the week. The quotes are moving sideways and testing the key levels at 1.11200 and 1.11450. Donald Trump earlier announced that on June 10 the US will introduce a 5% fee on all goods imported from Mexico. The increase of tension in the world economy lowers the demand on the risky assets. Further descend of EUR/USD remains possible. Open the positions from the key levels.
The Economic News Feed for 31.05.2019:
Real Personal Consumption (MoM) (US) – 15:30 (GMT+3:00);
Michigan Expectations Indices (US) – 17:00 (GMT+3:00);
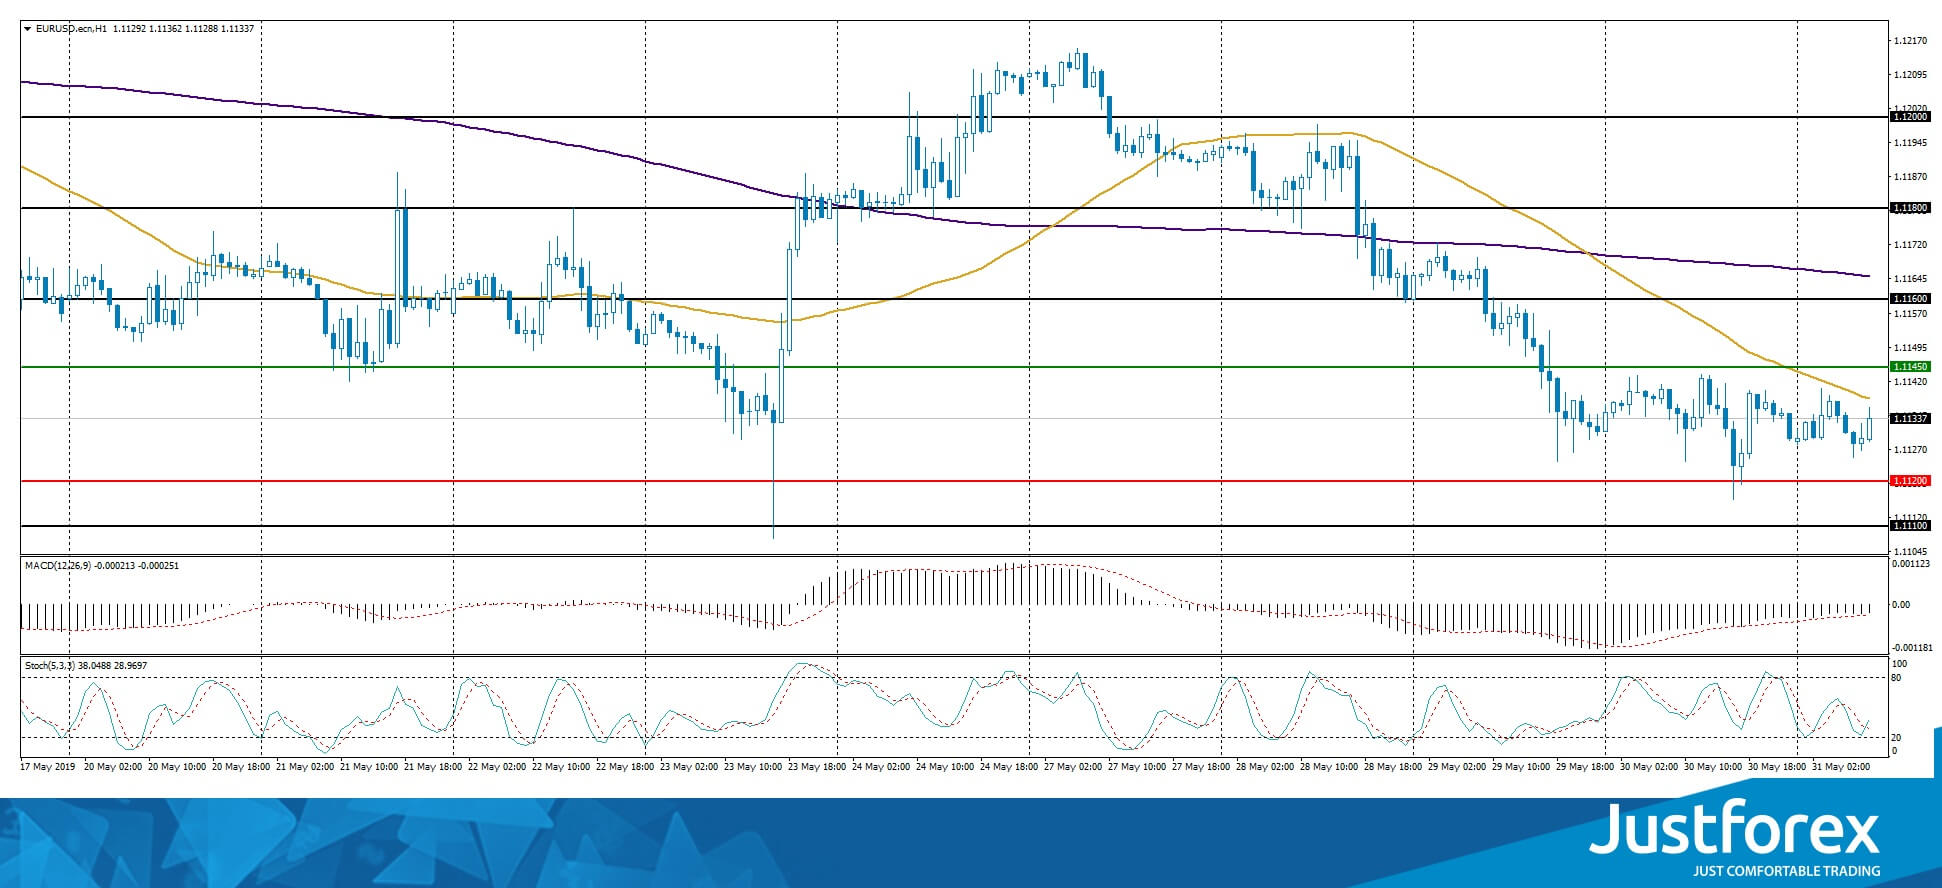
The price fixed below 50 MA and 200 MA which points to the power of the sellers.
The MACD histogram is in the negative zone but above the signal line which gives a weak signal to sell EUR/USD.
The Stochastic Oscillator is in the neutral zone, the %K line is crossing the %D line. There are no signals at the moment.
Trading recommendations
Support levels: 1.11200, 1.11000
Resistance levels: 1.11450, 1.11600, 1.11800
If the price fixes below 1.11200, expect further descend towards 1.11000-1.10700.
Alternatively, the quotes can grow towards 1.11600-1.11800.
The GBP/USD currency pair
Technical indicators of the currency pair:
Prev Open: 1.26201
Open: 1.26091
% chg. over the last day: -0.16
Day’s range: 1.25988 – 1.26166
52 wk range: 1.2438 – 1.3631
GBP stabilized after a long fall. The GBP/USD quotes are consolidating around 4-month minimums. The support and resistance levels are 1.25850 and 1.26200. The financial market participants are waiting for relevant info regarding Brexit. A technical correction is possible soon. You should open positions from the key levels.
The Economic News Feed for 31.05.2019 is calm.
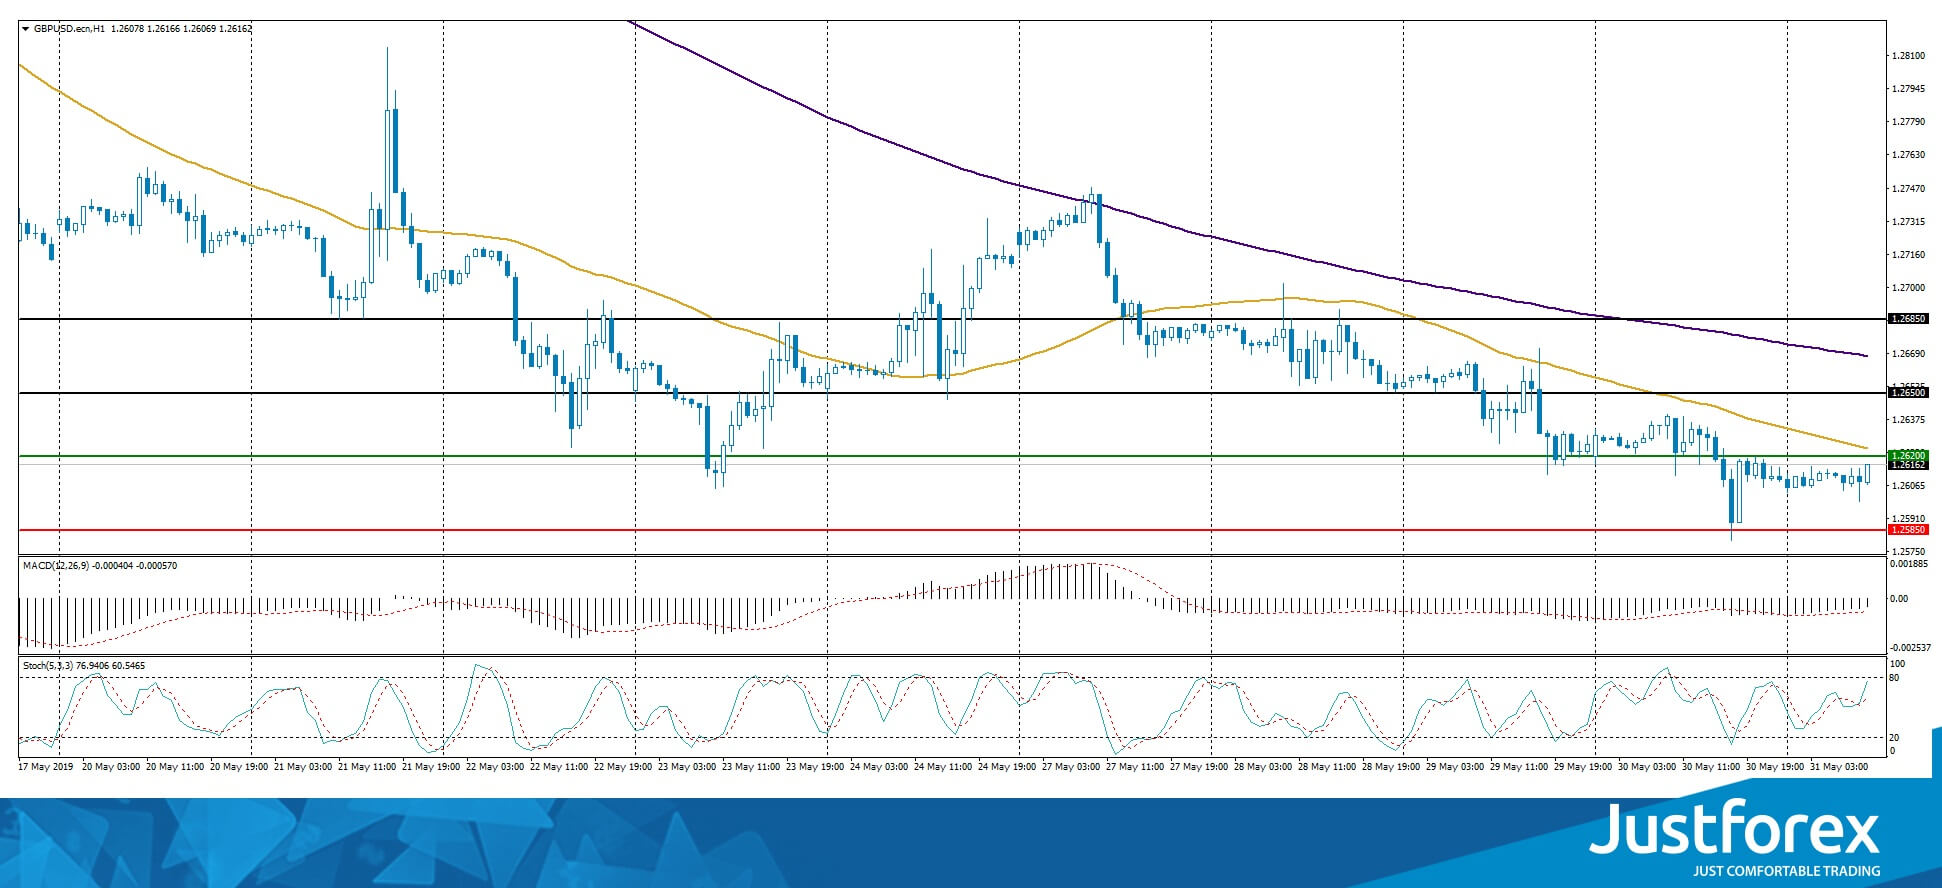
The price fixed below 50 MA and 200 MA which points to the power of the sellers.
The MACD histogram is in the negative zone but above the signal line which gives a weak signal to buy GBP/USD.
The Stochastic Oscillator is in the neutral zone, the %K line is above the %D line which points to the correction of GBP/USD.
Trading recommendations
Support levels: 1.25850, 1.25500
Resistance levels: 1.26200, 1.26500, 1.26850
If the price fixes above 1.26200, expect further correction towards 1.26500-1.26800.
Alternatively, the quotes can fall towards 1.25600-1.25400.
The USD/CAD currency pair
Technical indicators of the currency pair:
Prev Open: 1.34828
Open: 1.35164
% chg. over the last day: +0.17
Day’s range: 1.34937 – 1.35205
52 wk range: 1.2727 – 1.3664
USD/CAD stabilized after a long rally. The quotes are consolidating around 1.34850 and 1.35200. The Bank of Canada kept the monetary policy at the same levels. We expect important reports from the US. Keep an eye on the oil quotes dynamics and open positions from the key levels.
At 15:30 (GMT+3:00) Canada will publish CFTC CAD speculative net positions.
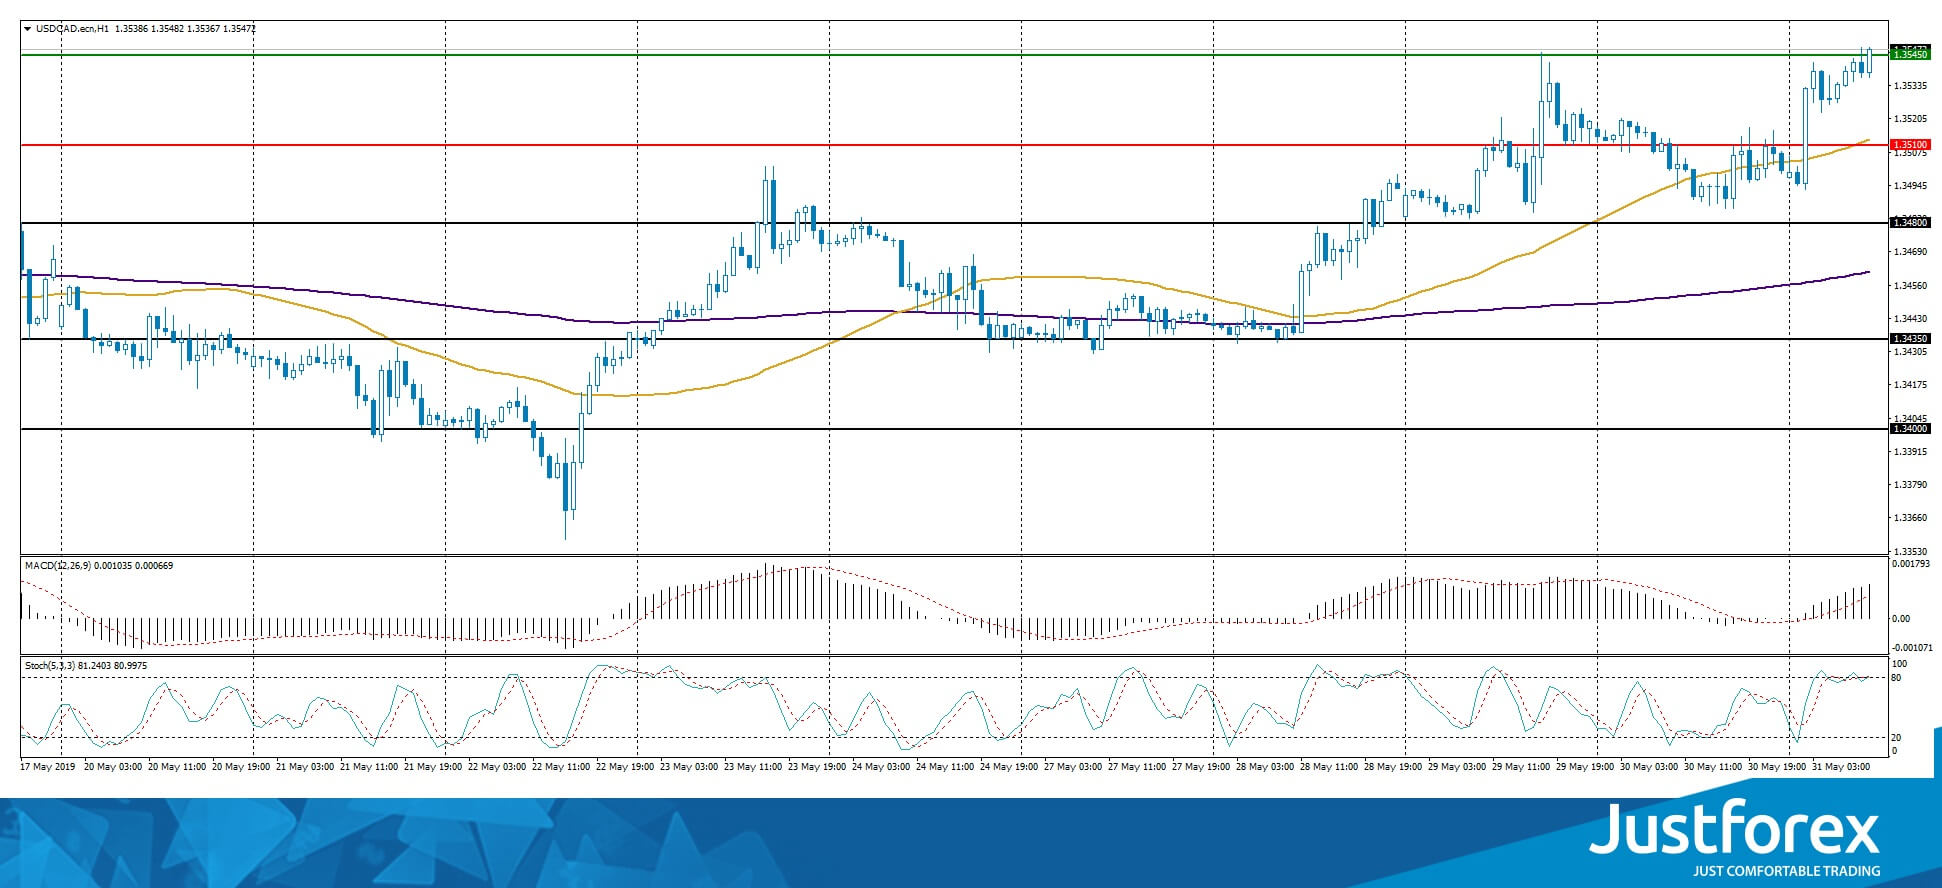
The indicators do not provide precise signals, the price is testing 50 MA.
The MACD histogram is in the positive zone but started to descend, which gives a weak signal to buy USD/CAD.
The Stochastic Oscillator is in the neutral zone, the %K line has crossed the %D line. There are no signals at the moment.
Trading recommendations
Support levels: 1.34850, 1.34550, 1.34300
Resistance levels: 1.35200, 1.35450
If the price fixes above 1.35200, expect further growth towards 1.35450-1.35700.
Alternatively, the quotes can descend towards 1.34600-1.34400.
The USD/JPY currency pair
Technical indicators of the currency pair:
Prev Open: 109.587
Open: 109.596
% chg. over the last day: +0.02
Day’s range: 108.782 – 109.621
52 wk range: 104.97 – 114.56
USD/JPY started to descend. During the last two days the quotes fell by 75 points. The trading instrument updated the key extremums. The trading conflict escalation introduced new demand for the safe assets. The quotes are testing the support at 108.800 and resistance at 109.150. JPY has prospects for further descend. You should open positions from the key levels.
Keep an eye on the US news feed.
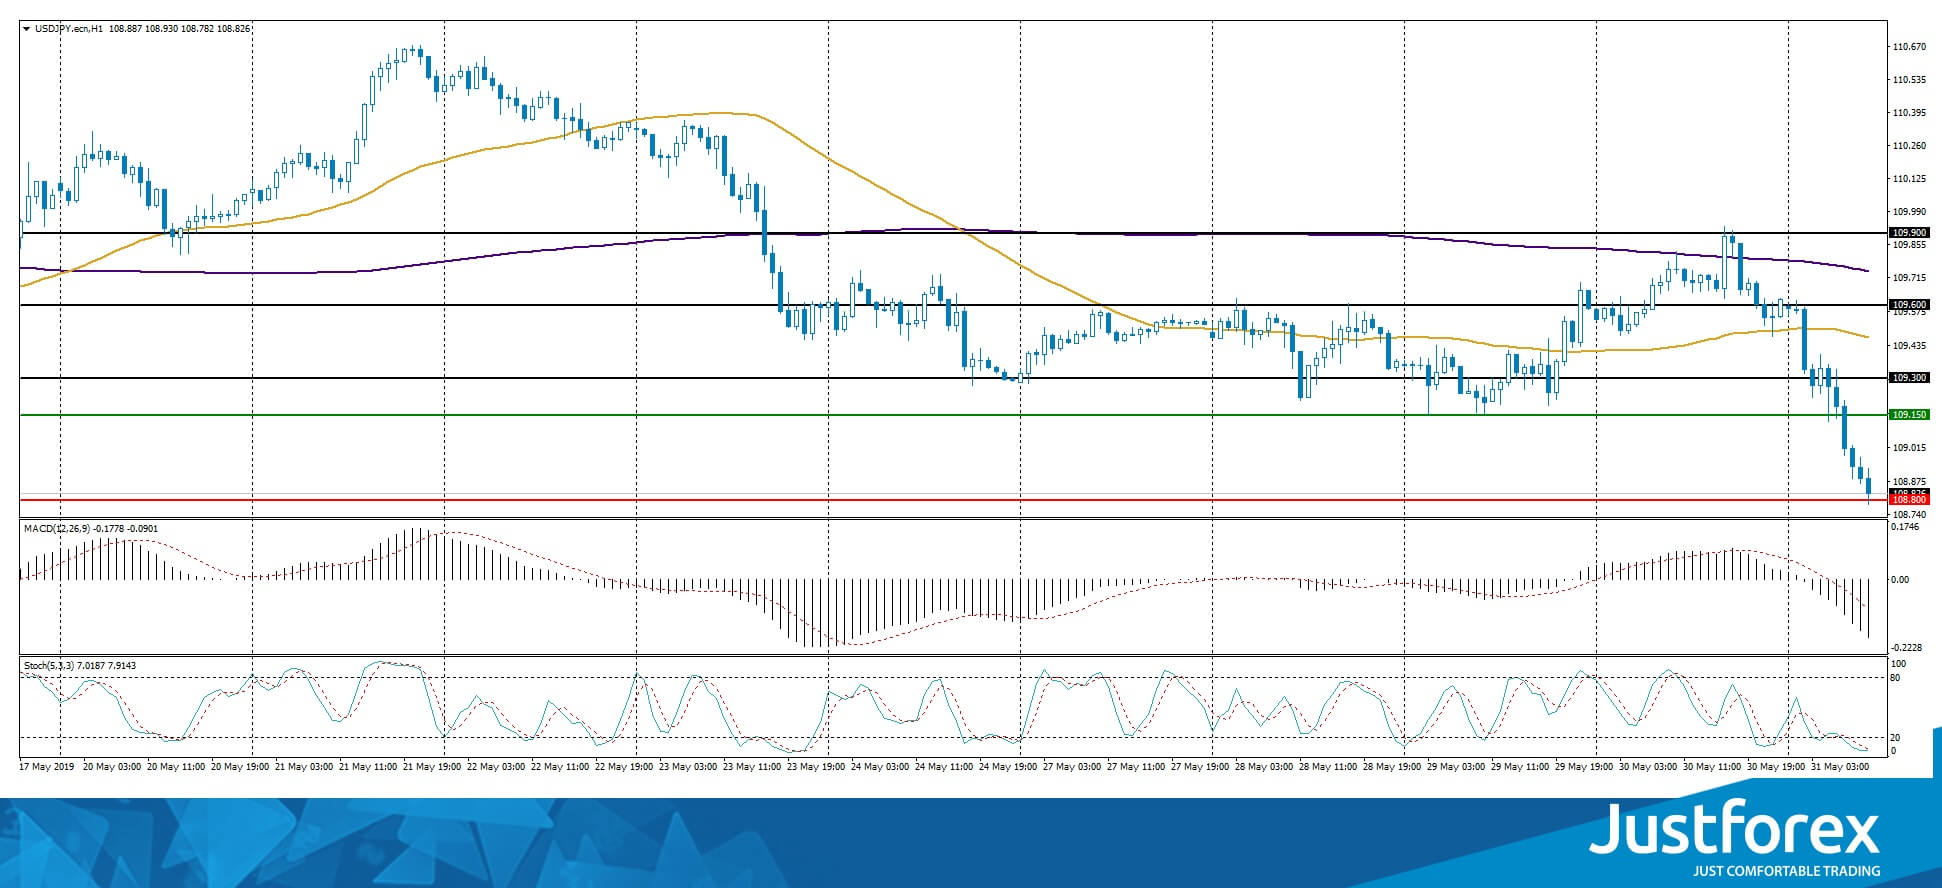
The price fixed below 50 MA and 200 MA which points to the power of the buyers.
The MACD histogram is in the negative zone and below the signal line which gives a strong signal to sell USD/JPY.
The Stochastic Oscillator is in the oversold zone, the %K line is crossing the %D line. There are no signals at the moment.
Trading recommendations
Support levels: 108.800, 108.500
Resistance levels: 109.150, 109.300, 109.600
If the price fixes below 108.800 expect further descend towards 108.500-108.300.
Alternatively, the quotes can recover towards 109.400-109.600.


