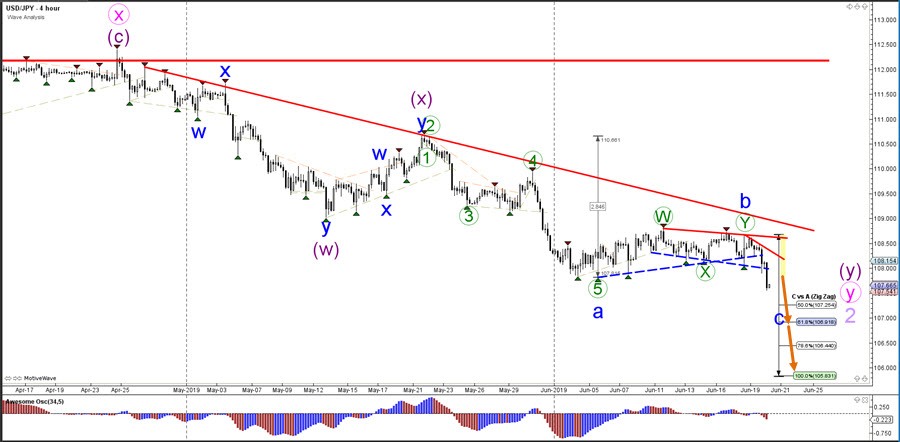
The USD/JPY has managed to break below the support trend lines (dotted blue) of the the lengthy bear flag pattern. This probably confirms the end of the bullish wave B (blue) swing and could indicate the start of a bearish wave C (blue). With a strong breakout candle in place, price is now likely to fall and move towards the Fibonacci levels of wave C vs A. The main target seems to be 106.75 for the moment.
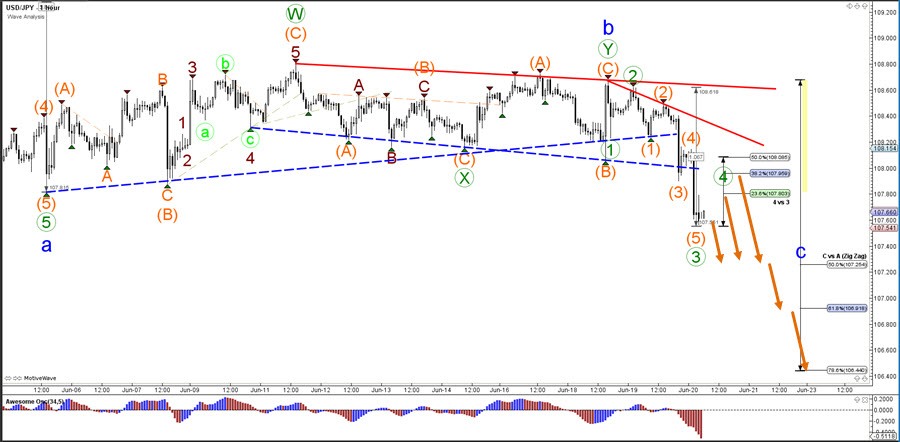
The USD/JPY bearish breakout seems to have made a strong impulse lower. For the moment price is expected to be either in a wave 3 (green) impulse or in a bullish pullback of wave 4 (green). If price is in a wave 4 then the Fibonacci levels of wave 4 vs 3 could act as resistance levels and bouncing spots for more downside.