
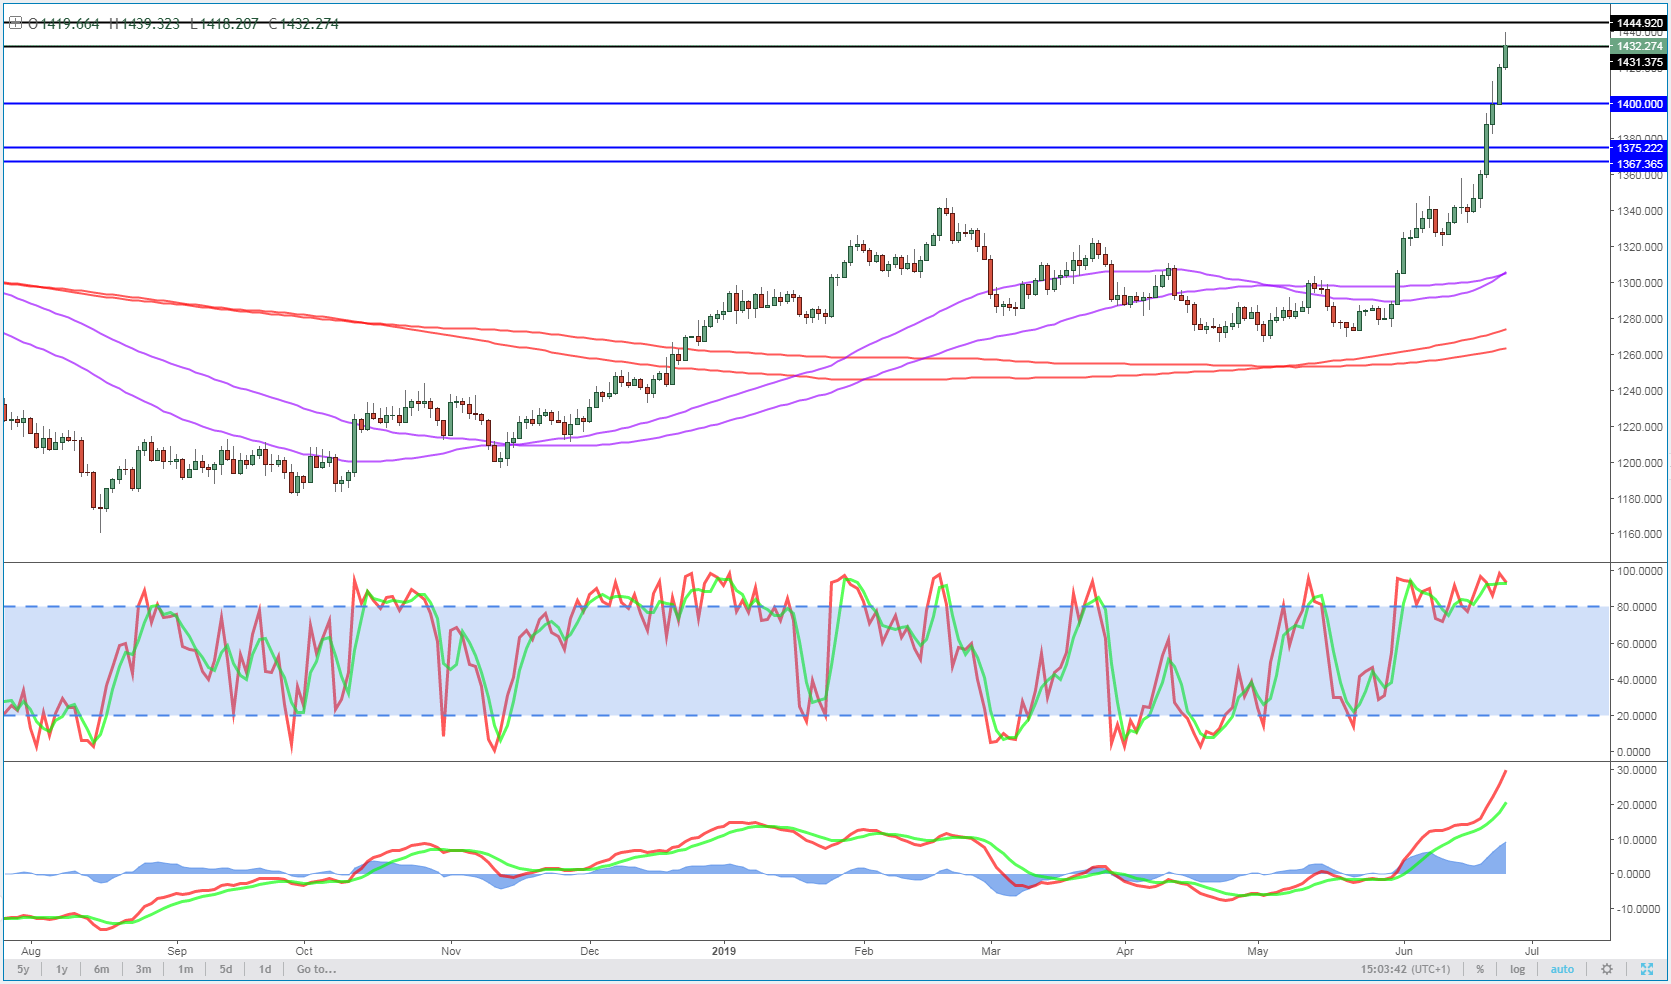
Gold is flying once again as it looks to extend its winning streak to six days and build on the almost 7% gains it’s made in that time.
Gold Daily Chart
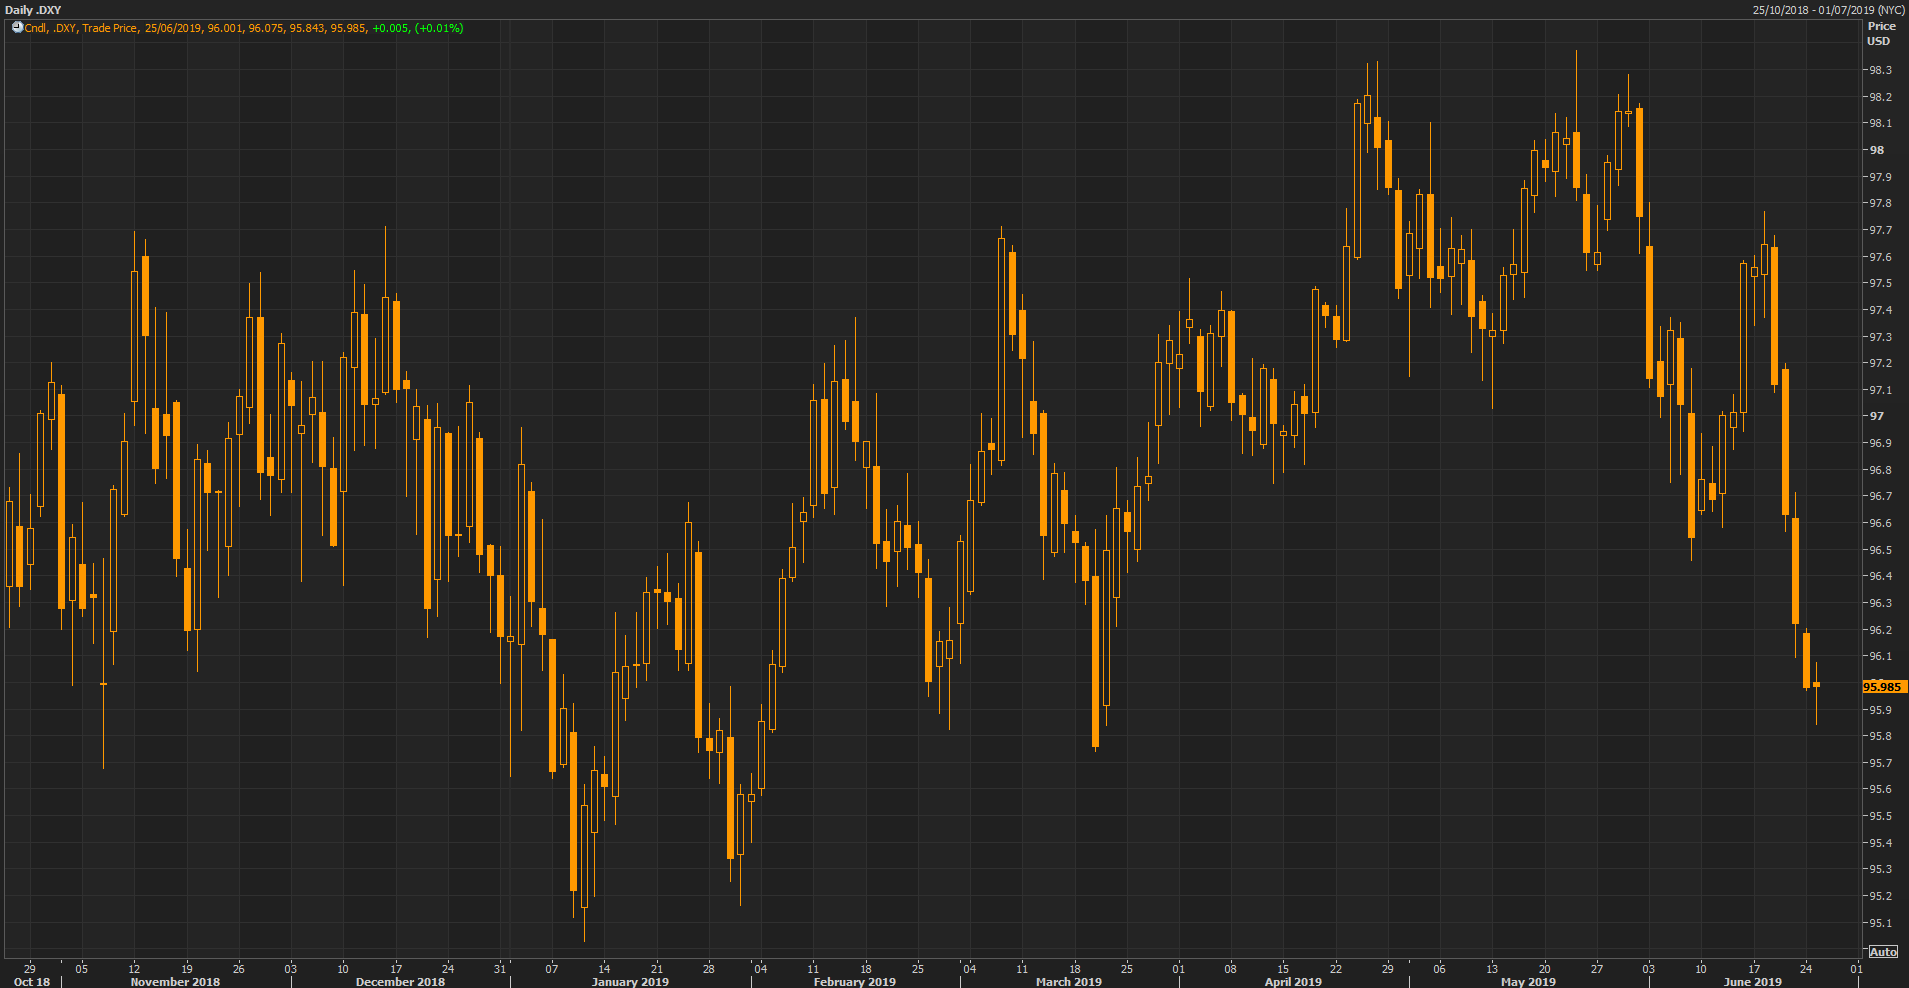
 All you have to do is look at a US dollar chart to see what the trigger for the surge has been.
US Dollar Index Daily Chart
Previously when we’ve traded around these levels – and for that we’re talking earlier this decade – $1,440 has been a notable area of support and resistance which may explain why we’ve seen some profit taking around here today.
What’s interesting is that we the rally doesn’t seem to be dropping any momentum so there may be some more room to run. The MACD histogram failed to make a new high during the most recent peak in price so some divergence may be creeping in but everything else looks ok on the 4-hour chart.
Gold 4-Hour Chart
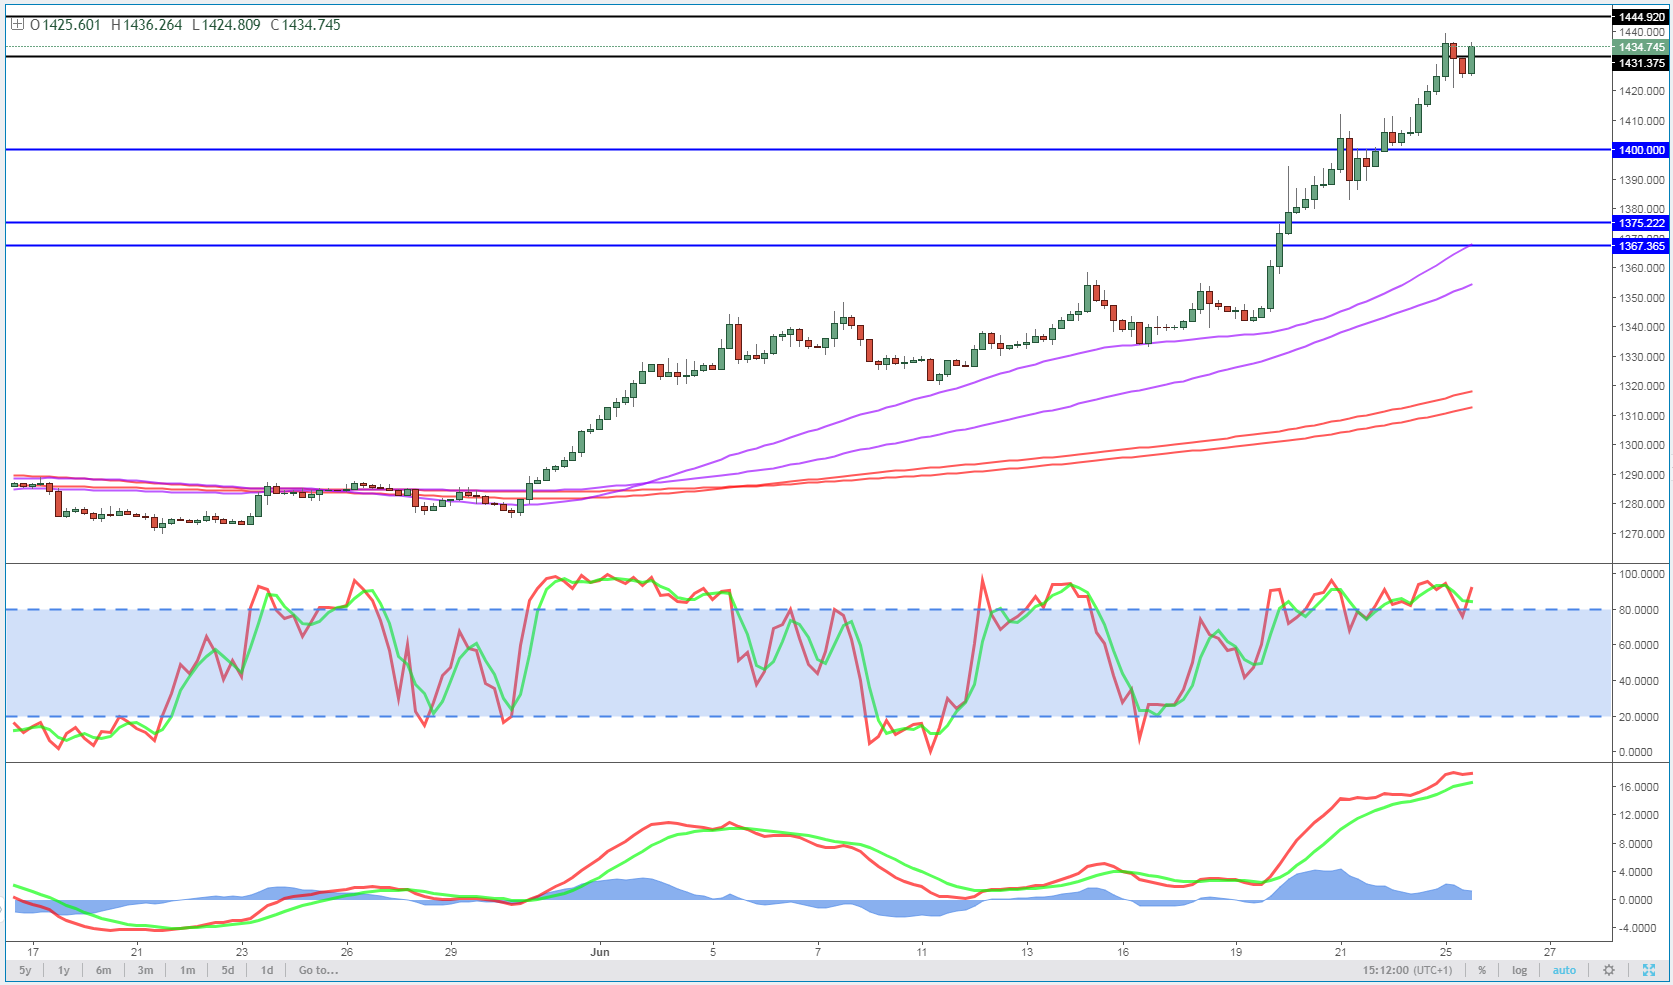
Above here, $1,475-1,488 was also interesting previously so perhaps we’re entering into a crowded area where momentum may start to slip.


