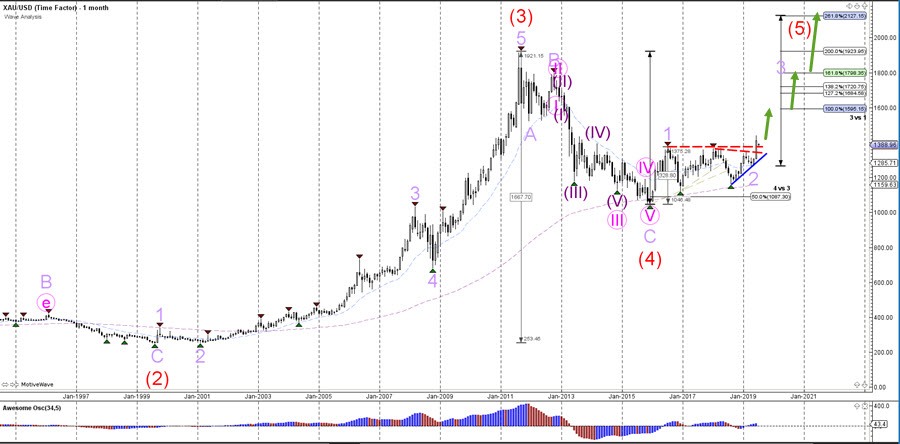
The XAU/USD (gold) has completed the wave 1-2 (purple) pattern now that price is breaking above the resistance trend lines (dotted red). The bullish breakout is probably part of a larger wave 4-5 (red) pattern after price made a bullish bounce and reversal at the 50% Fibonacci level of wave 4 vs 3.
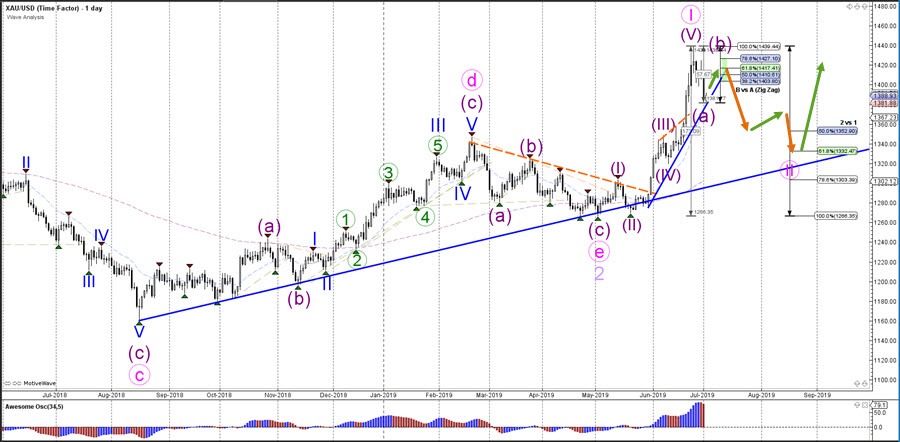
The XAU/USD has shown strong bullish momentum but currently price action is also moving down quickly. The upside is likely a bullish 5 wave pattern (purple), which in turn could complete a first wave 1 (pink). If that is the case, then the current pullback could be an ABC (purple) pattern within a wave 2 (pink). The wave B (purple) remains valid as long as price stays below the 100% Fib level of wave B vs A.