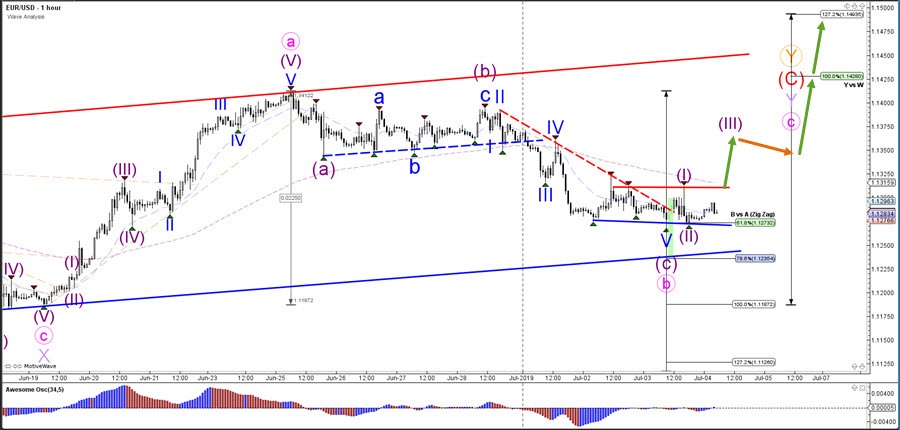
The EUR/USD is testing a strong support zone at the 61.8% Fibonacci retracement level and support trend line (blue) of the uptrend channel. A break below this support zone increases the chances of a new downtrend and makes a new wave pattern also more likely. A bullish breakout above the resistance trend line (red) however could confirm the end of the bearish price swing within wave C (purple) and confirm the start of a bullish price swing.
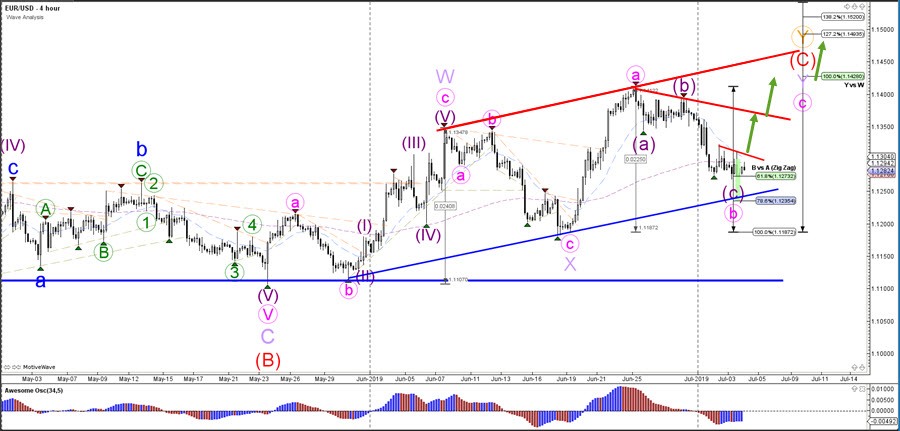
The EUR/USD seems to have completed 5 bearish waves (blue) within wave C (purple) but price will need to break above the resistance (red) before this wave pattern can be confirmed and becomes more likely. A bearish breakout would need to break below both support trend lines (blue) before the current wave pattern becomes less probable because a bullish bounce could also occur at 1.1250 and the 78.6% Fibonacci level.