
The EUR/USD currency pair
Technical indicators of the currency pair:
Prev Open: 1.12507
Open: 1.12533
% chg. over the last day: +0.02
Day’s range: 1.12495 – 1.12750
52 wk range: 1.1111 – 1.2009
The US dollar has stabilized against most world currencies. Investors are waiting for additional drivers. The quotes are consolidating around 1.12500 and 1.12800, respectively. According to the minutes of the last ECB meeting of the, the regulator does not exclude the introduction of additional incentive measures in the face of growing risks in the global economy. The technical picture signals a further recovery of the EUR/USD currency pair. We recommend to open positions from key levels.
The Economic News Feed for 12.07.2019:
Manufacturer’s Price Index (US) – 15:30 (GMT+3:00);
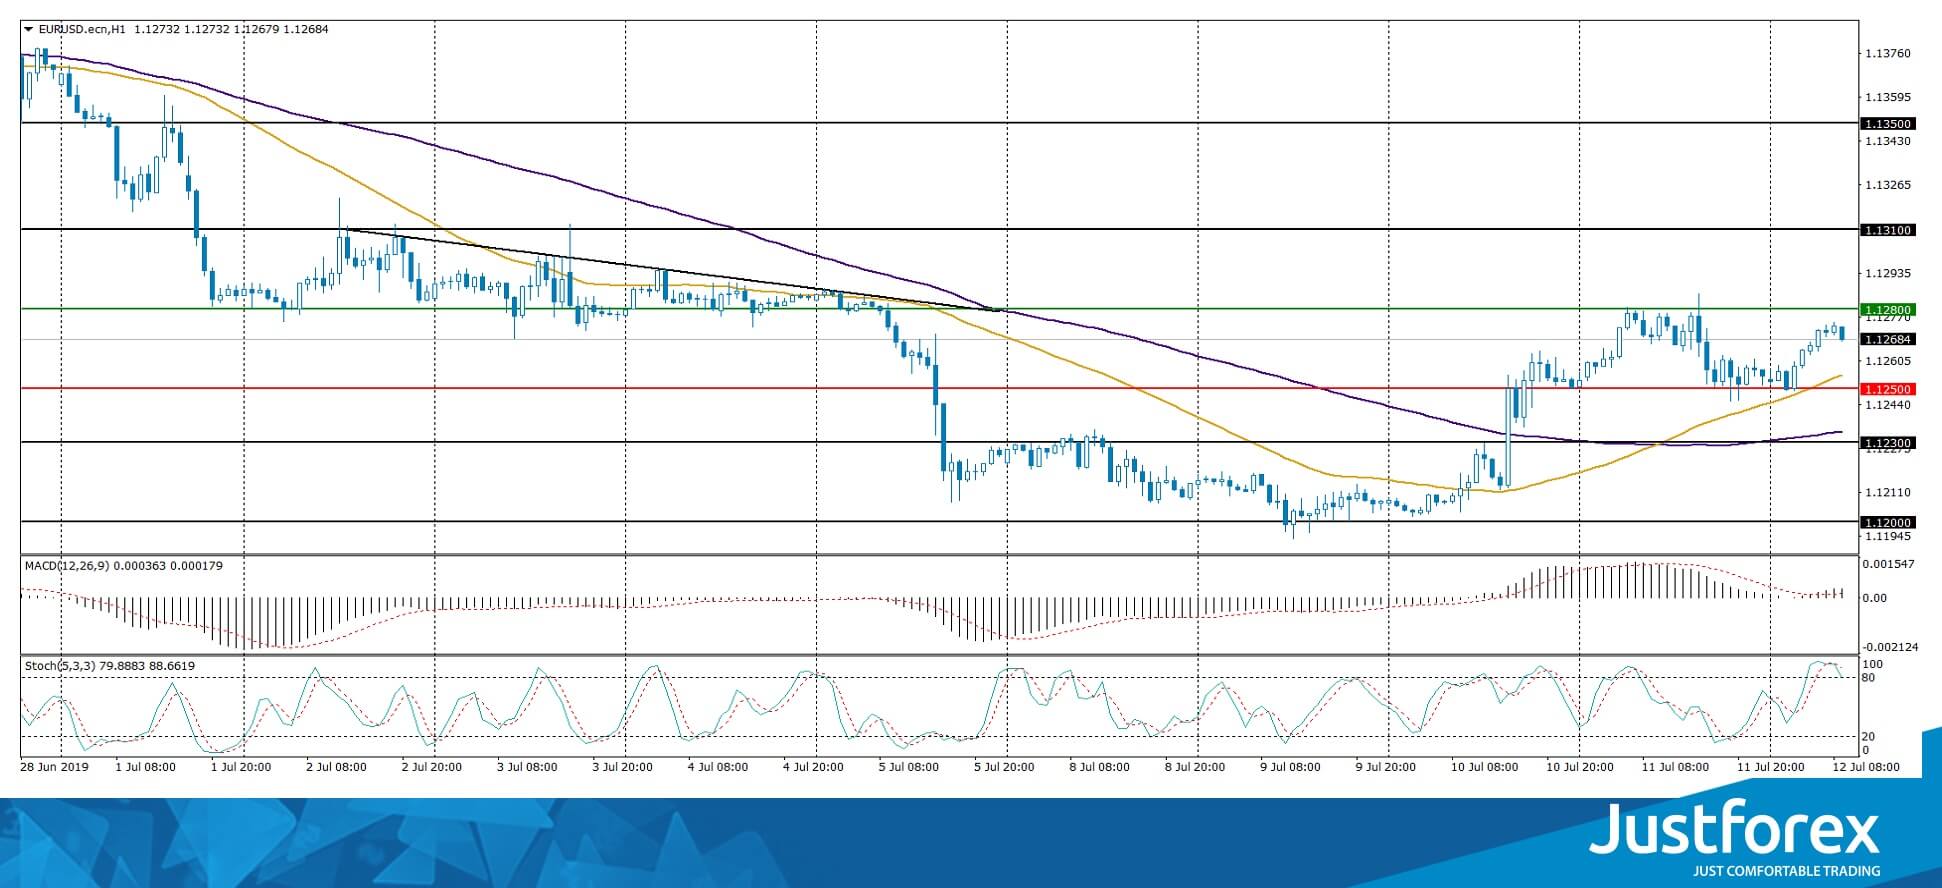
The price has fixed above 50 MA and 100 MA, which indicates the strength of buyers.
The MACD histogram has started to rise, which also gives a signal to buy EUR/USD.
The Stochastic Oscillator is in the overbought zone, the %K line crossed the %D line. There are no signals at the moment.
Trading recommendations
Support levels: 1.12500, 1.12300, 1.12000
Resistance levels: 1.12800, 1.13100, 1.13500
If the price consolidates above 1.12800, expect further groth toward 1.13100-1.13400.
Alternatively, the quotes can drop to 1.12200-1.12000.
The GBP/USD currency pair
Technical indicators of the currency pair:
Prev Open: 1.24974
Open: 1.25234
% chg. over the last day: +0.16
Day’s range: 1.25182 – 1.25485
52 wk range: 1.2438 – 1.3631
The GBP/USD currency pair is in a lateral movement without a defined trend. Support and resistance levels are 1.25150 and 1.25650, respectively. GBP can correct further. The financial markets participants continue to monitor the situation around Brexit. Today we expect important economic releases from the United States. You should open positions from the key levels.
The Economic News Feed for 12.07.2019 is calm.
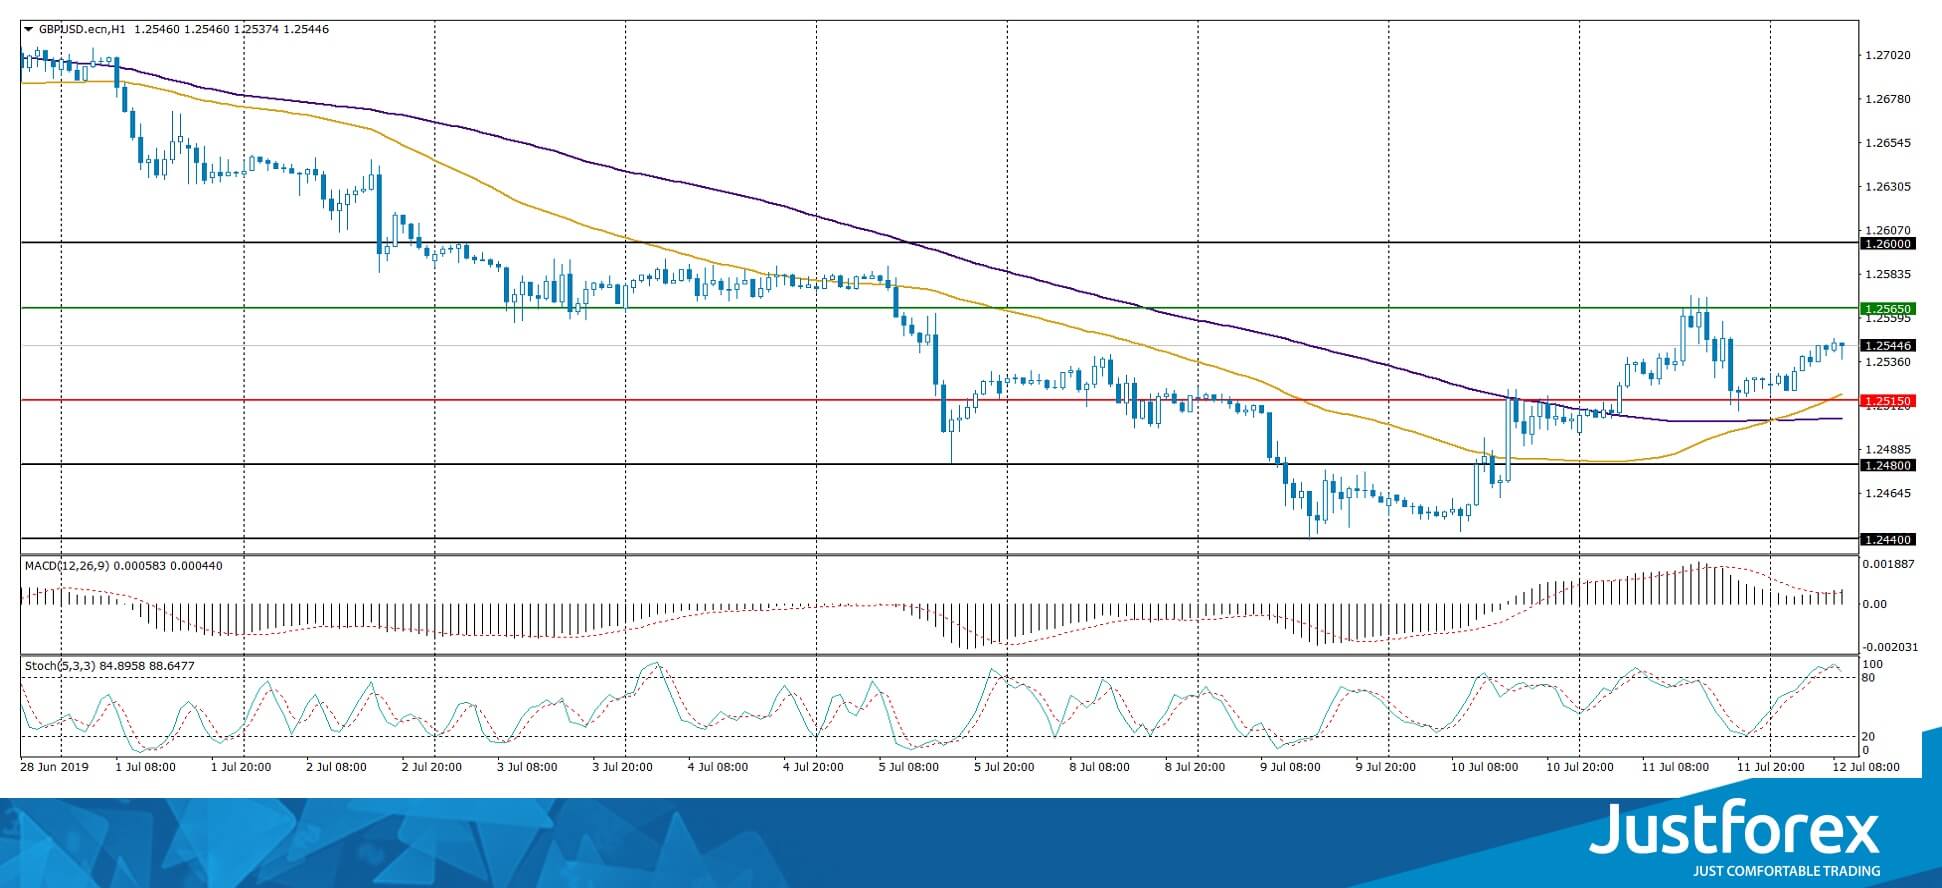
The price has fixed above 50 MA and 100 MA, which indicates the strength of buyers.
The MACD histogram is in the positive zone and continues to rise, which gives a strong signal to buy GBP/USD.
The Stochastic Oscillator is in the overbought zone, the %K line crossed the %D line. There are no signals at the moment.
Trading recommendations
Support levels: 1.25150, 1.24800, 1.24400
Resistance levels: 1.25650, 1.26000
If the price consolidates above 1.25650 expect further growth toward 1.26000.
Alternatively, the price could fall to 1.24800-1.24600.
The USD/CAD currency pair
Technical indicators of the currency pair:
Prev Open: 1.30806
Open: 1.30699
% chg. over the last day: -0.10
Day’s range: 1.30248 – 1.30717
52 wk range: 1.2727 – 1.3664
USD/CAD shows a negative trend and updated key extremes. At the moment, USD/CAD quotes are testing the local support of 1.30250. 1.30450 is already a “mirror” resistance. Trading instrument has the potential to decline further. A bullish mood on oil market provides additional support for CAD. You should open positions from the key levels.
The Economic News Feed for 12.07.2019 is calm.
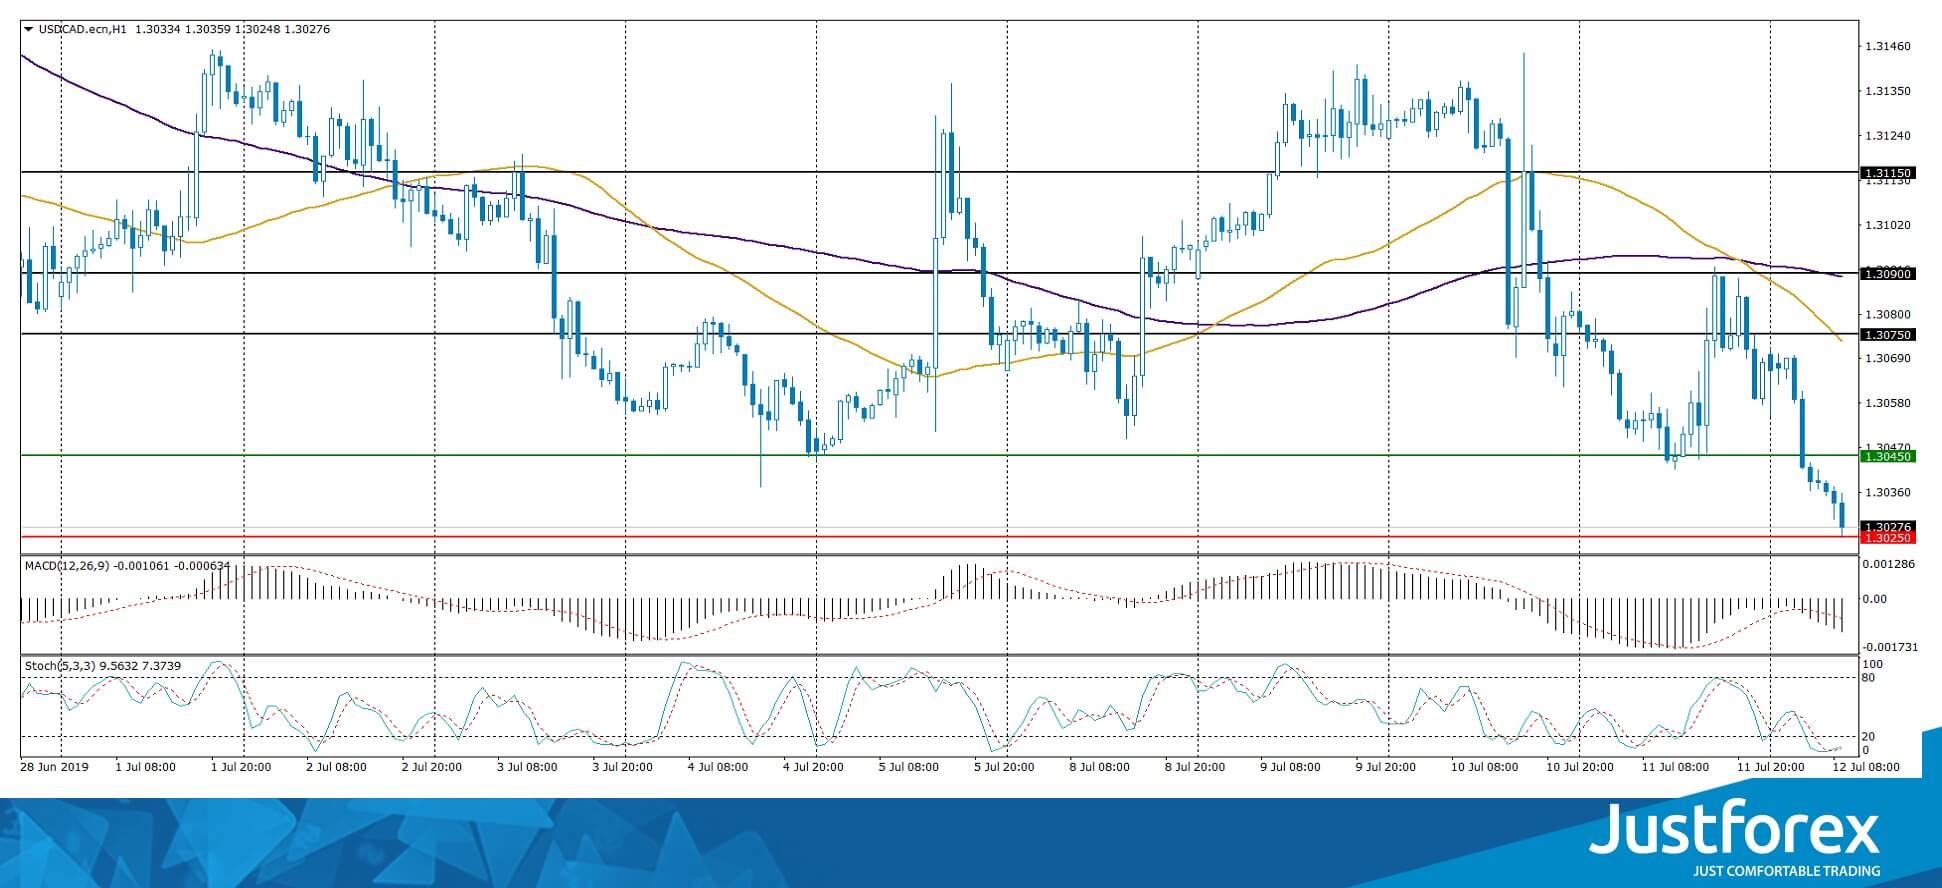
The price has fixed below 50 MA and 100 MA, which indicates the strength of the sellers.
The MACD histogram is in the negative zone and continues to decline, which gives a strong signal to sell USD/CAD.
The Stochastic Oscillator is in the oversold zone, the %K line crossed the %D line. There are no signals at the moment.
Trading recommendations
Support levels: 1.30250, 1.30000, 1.29750
Resistance levels: 1.30450, 1.30750, 1.30900
If the price consolidates below 1.30250, expect a further decline toward 1.30000-1.29750.
Alternatively, the quotes can grow to 1.30650-1.30800.
The USD/JPY currency pair
Technical indicators of the currency pair:
Prev Open: 108.423
Open: 108.489
% chg. over the last day: +0.08
Day’s range: 108.290 – 108.610
52 wk range: 104.97 – 114.56
An ambiguous technical picture emerged on the USD/JPY currency pair. The trading instrument is consolidating. The safe haven currency tests local support and resistance levels: 108.300 and 108.600, respectively. USD/JPY quotes have a downside potential. We recommend to pay attention to the dynamics of the yield of US government bonds. Positions must be opened from key levels.
During Asian trading session Japan published weak data on the volume of industrial production in May.
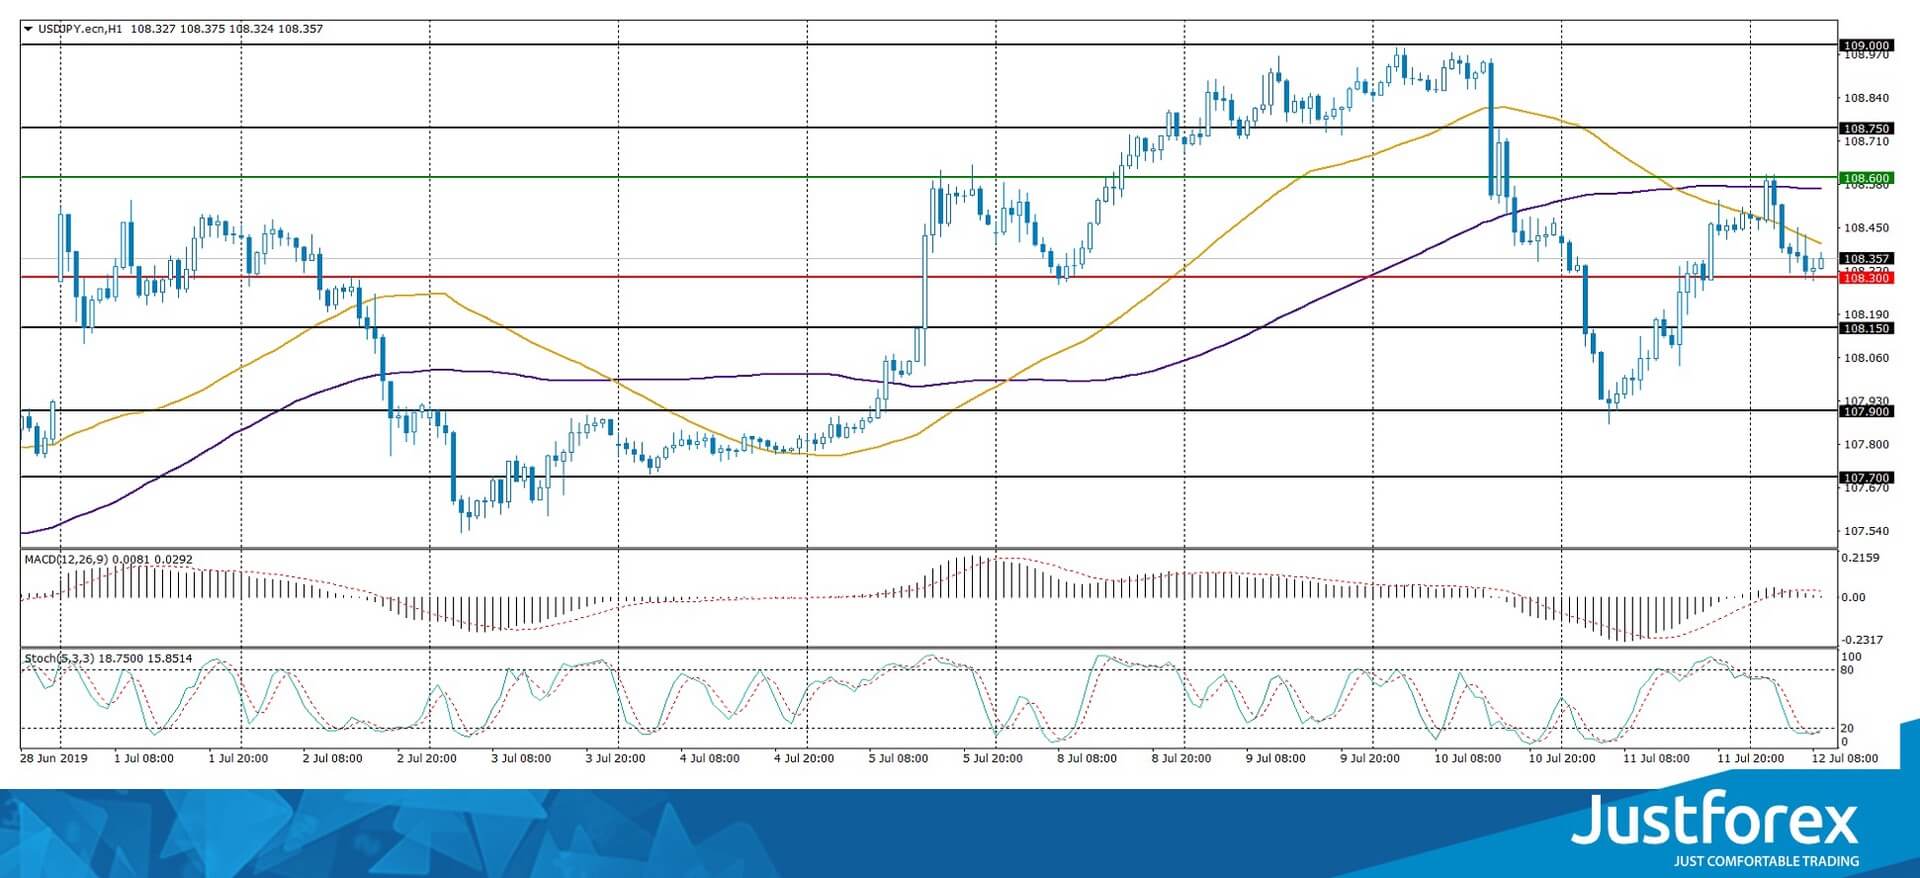
Indicators do not give accurate signals: the price crossed 50 MA and 100 MA.
The MACD histogram is near the 0 mark.
The Stochastic Oscillator is in the oversold zone, theK line crossed theD line. There are no signals at the moment.
Trading recommendations
Support levels: 108.300, 108.150, 107.900
Resistance levels: 108.600, 108.750, 109.000
If the price consolidates below 108.300, the USD/JPY quotes are expected to fall. The potential movement to 108.000-107.800.
Alternatively, the quotes could grow to 108.750-109.000.


