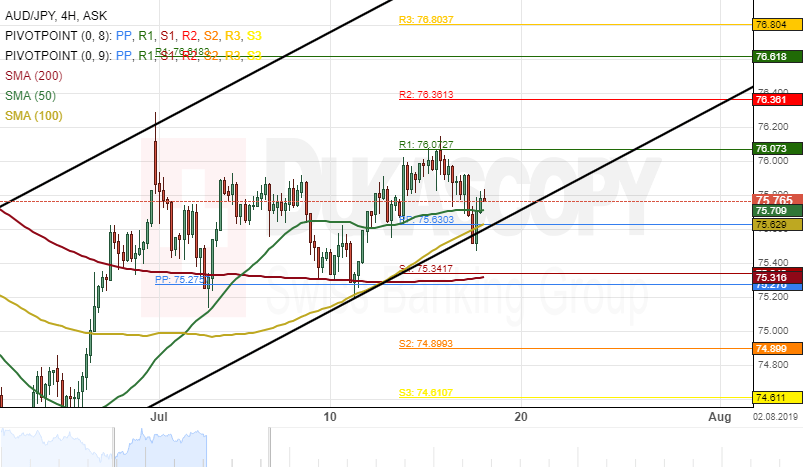
The AUD/JPY has been trading up since the middle of June after the pair bounced off the lower boundary of an ascending channel at 74.00 on June 17. The exchange rate reversed from the weekly R1 at 76.07 on July 16.
Technical indicators flash strong sell signals on the weekly time-frame chart. Therefore, it is likely that the Aussie will edge lower during next week’s trading sessions.
However, the currency exchange rate could reverse north from a support cluster formed by the weekly and the monthly pivot points and the 200-hour simple moving average at 75.30.