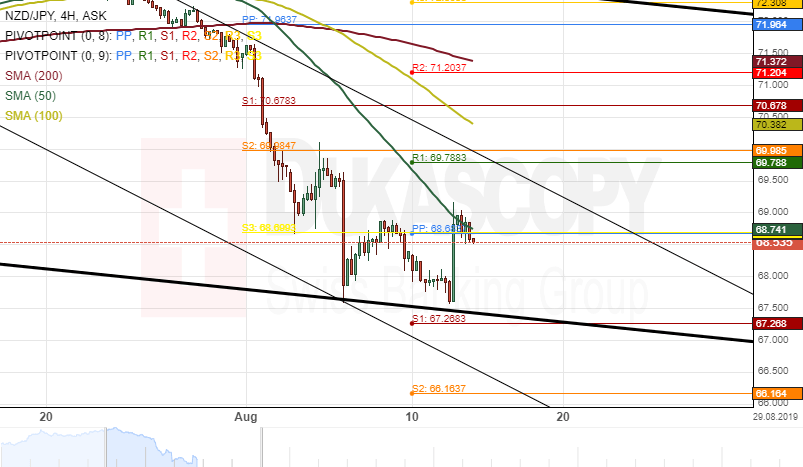
Downside risks have dominated the New Zealand Dollar versus the Japanese Yen during the past two weeks. The currency pair bounced off from a record low at 67.50 at the end of yesterday’s trading sessions.
Currently, the exchange rate is testing a resistance level formed by the 50- hour simple moving average at 68.77.
If the currency exchange rate passes the 50– hour SMA, a surge towards a resistance cluster formed by the monthly S1 at the 100– hour SMA at 70.67 could be expected during the following trading sessions.
However, if the resistance level holds, the NZD/JPY pair will continue its downward swing in the short term.